Bringing Semantics to Business Intelligence
“Cortex, what were my sales last month? Which stores and product categories had the highest profit margin?” Finally, after weeks of defining requirements with business users, building the data pipeline, establishing metadata, creating semantic views, and building a Cortex Agent, the agent is ready for users. The work is done… until you look at your BI tool.
Staring back at you is another grueling set of weeks of re-establishing data table relationships, recreating calculations for unity between the two tools, building a dashboard, and not to mention copy-and-pasting field descriptions.
For many organizations, the repeated work between setting up semantic layers in Snowflake and ensuring unity to dashboards is a huge hurdle to adopting Agentic Analytics. It’s imperative your dashboards return the same answers, otherwise both AI and BI will be laced with distrust. Dashboards, despite what that LinkedIn influencer just said, are not going away. AI, despite what that other LinkedIn influencer just said, isn’t ready to replace all of your reporting.
The solution isn’t to give up on AI or BI, it’s to be knowledgeable in how your BI tool and AI product combine together. Because we’re still in the early stages of semantic views and the Open Semantic Interchange (OSI) is still relatively new, the landscape is always changing and each BI tool varies drastically in its ability to utilize semantic views. To make it more confusing, the real-world examples online are often vague at best.
Whether you’re already a customer of one of these tools or you’re shopping for the best solution for your use case, this blog post will shed some light on how each tool connects to several of the most popular BI tools.
Setting the scene: it starts with data
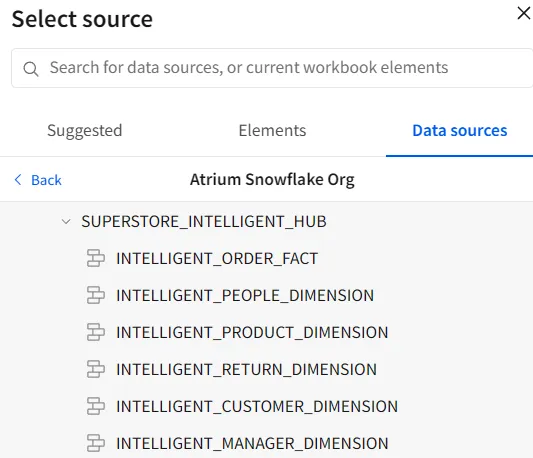
Just like any good data project, it all starts with the data. We are going to use a slightly modified version of Tableau’s Superstore data source. This data source will contain a fact table for orders and dimension tables for products, customers, people, and returns to form our “Superstore Domain.”
Each of the tables and columns in the data source contains a natural language description which is used to give AI the business context of each field and calculation. Each of the tables are then used in a semantic view in Snowflake. If you’re not familiar with Semantic Views, think of them as logical groupings of tables that are dynamically queried when a user attempts to use them. Semantic views are intended to be groups of metadata-driven and business-definition rich tables which the AI uses to dynamically construct answers based on natural language prompts.
Now for the BI tools: I’ll be comparing four of the most prevalent BI tools. Tableau and Power BI tout powerful visualization capabilities paired with AI offerings while ThoughtSpot and Sigma are quickly becoming AI-native BI leaders.
Finally, the comparison method. We won’t be ranking anything on a scale. Mostly because things change so quickly. Rather, we are going to present the facts on how each tool handles each of the following scenarios:
- Ease of connection: Each connection must be a live connection. Extracts don’t work on any tool because, by nature, a semantic view is an assortment of tables joined at query time by nature. For BI tools such as ThoughtSpot or Sigma, that’s not typically a shocker. Tableau and Power BI users, on the other hand, may find that information helpful.
- Metadata availability in the BI tool: You put in the work to add column descriptions which are helpful for humans and BI AI assistants. Let’s reuse the descriptions!
- Ability to query Facts within a Snowflake semantic view: Measures such as Sales need to be able to be aggregated.
- Ability to query Snowflake-defined metrics: Define your metric once in Snowflake and reuse it in the BI tool. One metric definition propagated through the ecosystem.
Tableau
Tableau is my personal favorite BI tool, so I was most curious to learn how Tableau would handle semantic views. One thing that sticks out for Tableau is that it has two ways to connect to a semantic view.
Standard Snowflake Connector
The first way is to connect the same way you would to any other Snowflake table. Select the Snowflake connector, authenticate to your instance, and drag the semantic view into the canvas.
From there, you can query the table similarly to any other table. Unfortunately, no column or table descriptions are automatically brought over as part of the connection. Additionally, there are some kinks to be aware of:
- Metrics created in Snowflake will appear. However, they aren’t query-able. They throw an error that there is an invalid metric expression. This isn’t the end of the world, but it does mean you need to have two copies of the calculation (Snowflake and Tableau).
- Columns with identical names across multiple tables (e.g. Order ID) won’t show up at all
- There’s no way of knowing which table the column is coming from.
Yes, most of those bullet points are pretty disappointing, but this is where the second connection option comes in handy.
Export TDS from Snowflake
Snowflake has a function which will create a Tableau Data Source file from your semantic view: SELECT SYSTEM$EXPORT_TDS_FROM_SEMANTIC_VIEW(‘my_sv_for_export’);
In my testing, this was actually my preferred method to connect. Within Snowflake, run the command against the semantic view you’re wanting to use, and you’ll download a TDS file. The back-end of the data source will look identical because it’s one table but the front-end resolves a few of the issues with the first option. The things to know are listed below.
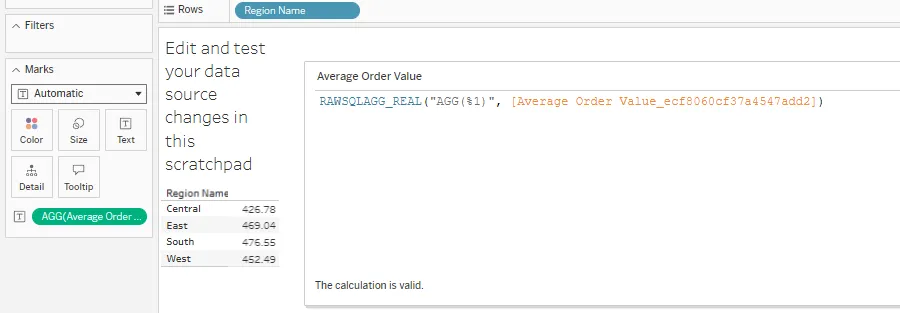
- Metrics defined in Snowflake not only work, they show up as calculations:
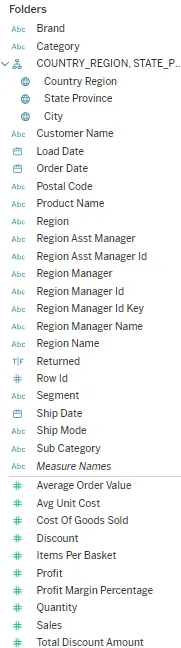
- Fields are broken out into folders based on the source table:
- Duplicate column names still don’t show up
- Tableau will try to automatically assign dimension/measure roles to fields. In this case, it overwrote the Quantity to be a Measure instead of a Dimension. And in this case, it was helpful. Remember this for later.
Between the two options, the TDS export from Snowflake was definitely the best. It does mean you need to download and replace the TDS as new columns are added or changes are made, but that process is relatively straightforward and most of the data work is done in Snowflake anyway.
My breakdown for Tableau is shown below:
| Criteria | Tableau (Default Connection) | Tableau (Snowflake Export) |
| Ease of Connection | ✅Simple and Standard | ⚠️Simple but requires download and replace after changes |
| Metadata Availability in the BI Tool | ⛔Not carried through. Repopulate column descriptions. | ⛔Not carried through. Repopulate column descriptions. |
| Ability to Query Snowflake Semantic View Facts | ✅No issue. | ✅No Issue. |
| Ability to Query Snowflake-Defined Metrics | ⛔Can’t tell which fields are metrics and they don’t work. | ✅Metrics added as RAWSQLAGG calculations. |
Power BI
Next, let’s move on to the tool most similar to Tableau: Power BI.
Power BI may have the largest asterisk on this list right now. It doesn’t work connecting to semantic views through the standard connector yet. If you try to connect, it will throw an error such as what is shown below.

However, there is a custom beta connector available for use on Github. This connector requires adjusting a security setting in Power BI and likely isn’t your enterprise solution, but it’s worth playing around with to get a feel if your organization allows it. Once you set up the connector, you’ll again see the full list of fields as if they came from the same table and you’ll be able to use Power BI as you normally would. The things to know are listed below:
- Metrics are shown as additive columns and they are able to be queried with dimensions
- Duplicate column names come in with an “_#” suffix
- Facts will be automatically read as dimensions. Recasting to additive columns is easy enough, though
- None of the metadata comes through to the field descriptions
Let’s add Power BI to our comparison matrix.
| Criteria | Tableau (Default Connection) | Tableau (Snowflake Export) | Power BI |
| Ease of Connection | ✅Simple and Standard | ⚠️Simple but requires download and replace after changes | ⛔Not using a Certified Connector |
| Metadata Availability in the BI Tool | ⛔Not carried through. Repopulate column descriptions. | ⛔Not carried through. Repopulate column descriptions. | ⛔Not carried through. Repopulate column descriptions. |
| Ability to Query Snowflake Semantic View Facts | ✅No issue. | ✅No Issue. | ⚠️Likely need to recast as additive measures. |
| Ability to Query Snowflake-Defined Metrics | ⛔Can’t tell which fields are metrics and they don’t work. | ✅Metrics added as RAWSQLAGG calculations. | ⚠️Metrics appear as additive measures with limited visibility. |
Sigma
Up next, some of the newer BI tools in the market. Sigma is growing quickly and boasts a very strong partnership with Snowflake. In fact, Sigma even has its own documentation for connecting to semantic views. It’s worth noting this is also a beta feature, but it’s built by Sigma and part of the native platform.
The connection process to a semantic view in Sigma is slightly different from a regular connection. The initial steps are the same. However, once you find the semantic view, you expand the semantic view to select one of the tables from the list. This is different from Power BI and Tableau, which bring in the entire semantic view.
From there, you can view the available columns. This is where you’re able to bring in fields from other tables in the semantic view. This is also where some of the most important things to know show up:
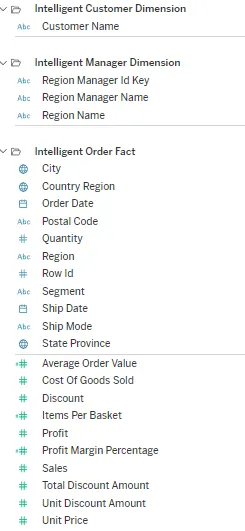
Unlike the other tools, the column descriptions are brought over from Snowflake! This not only makes the data model easier for users and developers. It also means Sigma’s AI offerings will have more rich metadata when analyzing data. Ex: Does “Segment” mean Product Segment or Customer Segment? Hover over the tooltip and you’ll know because the description was added in Snowflake!
Facts, however, don’t appear available for use. Remember when I said to remember that Quantity is errantly a Dimension in the semantic view instead of a Fact? This is where that comes into play. Quantity, a Dimension, does show up in the available columns. Sales, a Fact, does not show up in the available columns along with the other facts. Thankfully, this is mentioned in the documentation.
Metrics do show up in the available metrics, but they aren’t usable as metrics. Rather, they come through as row-level values, which isn’t much help on their own. Thankfully, Snowflake brings in more information than just the description. It also adds the calculation being used! This means I can create the metric in Sigma without having to navigate back to Snowflake to find the calculation and translate it into a Sigma function.
Finally, columns with identical names to other columns won’t appear.
Let’s add Sigma to our semantic view matrix.
| Criteria | Tableau (Default Connection) | Tableau (Snowflake Export) | Power BI | Sigma |
| Ease of Connection | ✅Simple and Standard | ⚠️Simple but requires download and replace after changes | ⛔Not using a Certified Connector | ✅Simple. Choose a starting table and bring in additional columns as needed. |
| Metadata Availability in the BI Tool | ⛔Not carried through. Repopulate column descriptions. | ⛔Not carried through. Repopulate column descriptions. | ⛔Not carried through. Repopulate column descriptions. | ✅All metadata AND calculations show up. |
| Ability to Query Snowflake Semantic View Facts | ✅No issue. | ✅No Issue. | ⚠️Likely need to recast as additive measures. | ⚠️Won’t appear. Must have all facts as dimensions in order to use. |
| Ability to Query Snowflake-Defined Metrics | ⛔Can’t tell which fields are metrics and they don’t work. | ✅Metrics added as RAWSQLAGG calculations. | ⚠️Metrics appear as additive measures with limited visibility. | ⚠️/✅Metrics appear, but require recreation using the calculation shown on hover. |
ThoughtSpot
The last tool we’ll review is ThoughtSpot. ThoughtSpot is interesting because it differs the most from the other BI tools. It does have dashboards (Liveboards), but the real draw is one of the most robust agentic offerings called “Spotter.” ThoughtSpot’s connection to semantic views has implications for both the ability to create visualizations for standard reporting and use in an AI agent which can be embedded in a website. Before we go too far, let’s set up the connection.
The initial connection is similar to any other data model. Choose the Snowflake connection, drag the semantic view in (just one view, not tables within the semantic view), select the columns you want, and review the data types ThoughtSpot interpreted from the view. From there, you’re ready to start using the data model in a Liveboard and enable use with Spotter. Let’s jump into the things to know with ThoughtSpot:
- Column descriptions are carried through from Snowflake. Additionally, there is another set of metadata that can be added in ThoughtSpot called “AI Context” which is used to instruct Spotter. The description metadata is different from the AI Context, so you don’t lose any functionality by reusing the description. Synonyms from Snowflake, however, will not be carried over from Snowflake.
- Columns with duplicate names don’t show up in ThoughtSpot.
- You can’t see which table a column originates from.
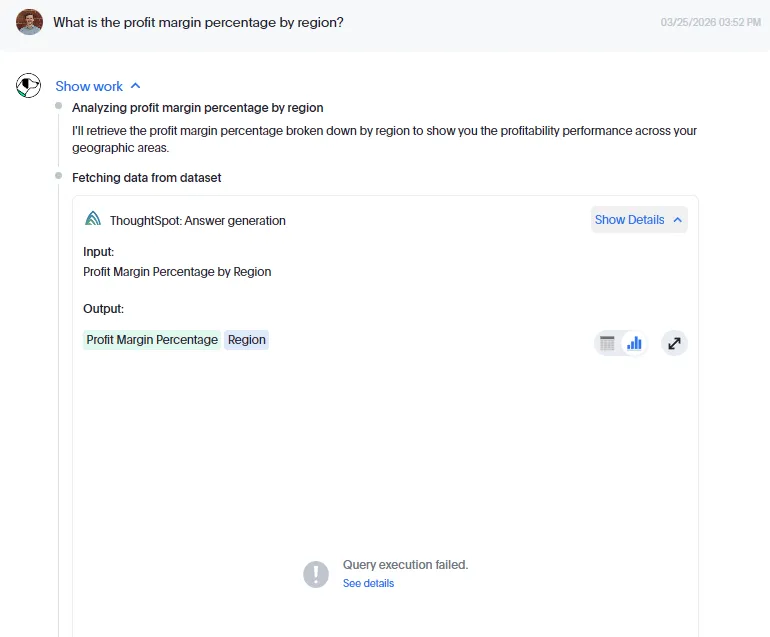
- Metrics will show up with descriptions. However, the metrics throw an error when you try to query them. You can recreate the metric in the same way you could any of the other tools. But this is where ThoughtSpot gets interesting…
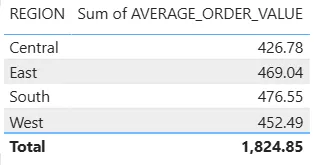
- ThoughtSpot’s Spotter does more than just translate a sentence into a series of fields. It reasons its way through issues to provide answers. Here’s what happened when I asked it to return the profit margin percentage by region. Profit margin percentage is a metric in the semantic view, which returns an error when trying to query it directly.
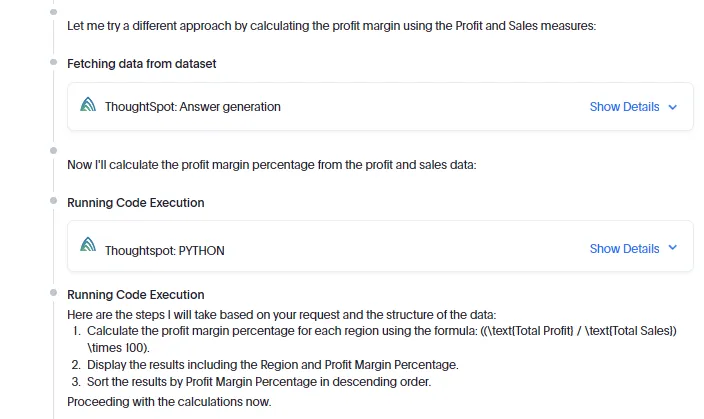
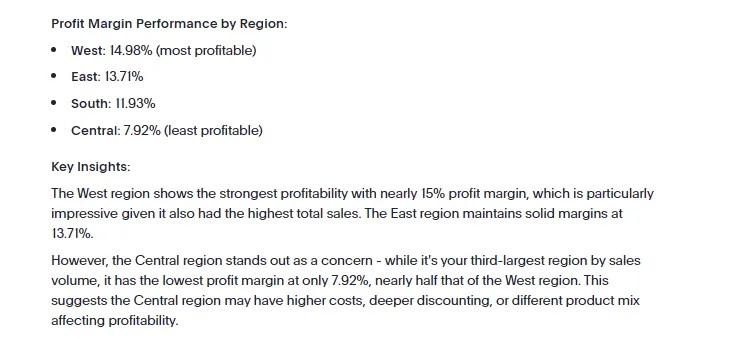
In a real use case, I would remove the broken field and just create the calculation. However, this is really interesting that ThoughtSpot will reason its way to an answer despite the fact the semantic view connection still had some kinks to work out.
Let’s add our final BI tool to the matrix:
| Criteria | Tableau (Default Connection) | Tableau (Snowflake Export) | Power BI | Sigma | ThoughtSpot |
| Ease of Connection | ✅Simple and Standard | ⚠️Simple but requires download and replace after changes | ⛔Not using a Certified Connector | ✅Simple. Choose a starting table and bring in additional columns as needed. | ✅Simple and Standard |
| Metadata Availability in the BI Tool | ⛔Not carried through. Repopulate column descriptions. | ⛔Not carried through. Repopulate column descriptions. | ⛔Not carried through. Repopulate column descriptions. | ✅All metadata AND calculations show up. | ✅All metadata shows up. |
| Ability to Query Snowflake Semantic View Facts | ✅No issue. | ✅No Issue. | ⚠️Likely need to recast as additive measures. | ⚠️Won’t appear. Must have all facts as dimensions in order to use. | ✅No issue. |
| Ability to Query Snowflake-Defined Metrics | ⛔Can’t tell which fields are metrics and they don’t work. | ✅Metrics added as RAWSQLAGG calculations. | ⚠️Metrics appear as additive measures with limited visibility. | ⚠️/✅Metrics appear, but require recreation using the calculation shown on hover. | ⚠️/✅Metrics appear but won’t work on their own. Spotter will use context to recreate calculations. |
Final thoughts for your BI tooling
What does this mean? Should you drop your existing BI tool for another based on this analysis?
Not at all. We’re early in the journey of exploring semantic views across Snowflake and BI. Rather, I encourage you to be aware of the options your BI tool has along with any updates that come out among these tools. Try connecting to a simple semantic view using your BI tool to get a feel for how it works and feels. Semantic views aren’t going to take over your dashboard reporting yet. You can’t join semantic views to other semantic views or tables in any of the tools yet and giant semantic views are cumbersome (not to mention not best practice but that’s a separate blog), so your reporting capabilities are somewhat limited anyway.
Ultimately, the end goals of semantic views in Snowflake are to centralize your business logic to the data warehouse layer and to define calculations in one place so everyone gets the same answers. This is going to take a while, but don’t be left behind when it grows into something enterprise-ready because it’s going to be significant!