


Inside ThoughtSpot Analyst Studio: Turning Python Logic into Revenue-Driving Sales Decisions
In the world of sales, the difference between a record-breaking quarter and a missed target often comes down to the ability to distinguish a healthy pipeline from one that has stalled. Sales leaders have more data than ever, but they face a persistent “Insight Gap.” Traditionally, advanced predictive modeling happens in a silo. A data scientist builds a sophisticated model, but the output ends up in a static report that is difficult for a manager or a front-line rep to interpret, let alone act upon in real-time. To win in today’s market, businesses must bridge this gap. You need to take the power of advanced data science and place it directly into the hands of the people making decisions and driving deals.
In this post, we’ll demonstrate how ThoughtSpot Notebooks and Spotter work together to turn complex Python logic into a simple, natural language conversation. We will walk through the end-to-end journey, beginning with using ThoughtSpot Notebooks to build a “champion” model to score opportunities based on their likelihood to convert. From there we’ll use the Notebook to investigate behavioral patterns and engineer specific features (like deal velocity or seasonality) that relate to unique sales cycles. Finally, we will show you how to operationalize those scores immediately to provide steps for managers to coach their reps on how to grow a pipeline and increase win rate. By the end of this blog post, you’ll see how the complex back-end modeling can become a front-end catalyst to drive revenue. But first, let’s look at the engine that makes this possible: ThoughtSpot.
Get to know ThoughtSpot
ThoughtSpot is a cutting-edge search and AI-powered analytics platform that connects directly to live cloud data to deliver instant business answers. By letting users ask questions in natural language (like using a search engine), it eliminates the need for complex, static dashboards and reports. ThoughtSpot democratizes data access, empowering every employee, from the executive suite to the front lines, to discover AI-driven insights (Spotter) and make faster, data-backed decisions based on the most current, granular data available. There are a few key differentiators when it comes to using this tool:
- Search-Driven Analytics: Ask questions in plain language and get instant, granular results.
- AI-Powered Insights (Spotter): Automatically highlights and explains key data trends and anomalies, surfacing insights you might not even know to look for.
- Direct Cloud Connectivity: ThoughtSpot works with live data in your modern cloud data warehouse (Snowflake, etc.).
- Analyst Studio: A comprehensive workspace that allows data professionals to build, manage, and scale data models and notebooks within the same ecosystem where users consume the data, allowing for more flexibility and complexity.
Ultimately, ThoughtSpot serves as the dashboarding and analysis tool, as well as the natural language search engine for the entire champion model. Once your data is connected, it is the only tool you need to go from raw numbers to revenue-driving decisions.
ThoughtSpot Notebooks
To build a predictive engine that actually works for your sales team, you need more than just a standard algorithm; you need an environment that can handle the complexity of your specific business logic. This is where ThoughtSpot Notebooks come in.
ThoughtSpot Notebooks provide an interactive, web-based environment that combines live code, rich visualizations, and narrative text. Unlike traditional workflows where data must be exported to a separate tool for analysis, ThoughtSpot Notebooks allow Python to run directly within the analytics platform. By “bringing the code to the data,” we eliminate the security risks and lag time associated with data movement, ensuring our models are always built on the most current information available.
To navigate and use Notebooks in ThoughtSpot, click “Analyst Studio” in your Data Workspace. Once in Analyst Studio, click the “Plus” sign to create a new Python Notebook. To leverage your data that is in ThoughtSpot in the Notebook, add the dataset in the left hand panel by clicking the “Plus” sign next to your data. Then in the Python code, reference your data with datasets[‘dataset_name’].
Feature engineering
Features are variables that are inputted into a predictive model and engineering them is the process of calculating new variables from existing data. Our first goal is to understand what actually drives a “Closed-Win” opportunity. Every sales cycle has its own unique pulse, so we use the capabilities of Notebook to explore behavioral patterns and engineer business-specific features that a generic model might miss. For this walkthrough, we focused on deal velocity (DURATION_DAYS) and seasonality (IS_QUARTER_END).
Deal velocity is the number of days an opportunity is open. By understanding the typical deal cycle, the model can identify opportunities that are moving too fast or too slow to be effective. Seasonality is a flag for opportunities that close at quarter end to account for sales behavioral changes that impact conversion rates.
By using Notebooks, we can experiment with different variables in real-time without moving data off platform. It makes the level of specific business customizations possible by allowing us to refine our logic as we discover new patterns. Most importantly, it allows us to document our methodology alongside our code, creating a transparent “source of truth” for how our sales insights are calculated. The Notebook serves as the bridge between raw data and business logic.
Scoring model
Once our business-specific features are defined (deal velocity and seasonality), the Notebook can serve as a platform to train and test different modeling algorithms simultaneously. By comparing performance metrics like accuracy and precision directly within the Notebook, we automatically identify the “champion” model. This top-performing model is then used to score live opportunities, providing each deal with a win probability score and, more importantly, a clear look at the factors driving that score.
In traditional environments, model selection often feels like a “black box” process where data goes in and a score comes out with little explanation. The Notebook changes that by bringing the selection process into the light and allows for a side-by-side comparison of the different models. This comparison can be visualized directly alongside the code to provide a clear presentation of the model selection process.
After your opportunities are scored by your model, click the “Use Output” drop down in the code chunk that generates your table to create a dataset. Then the dataset can be published by first clicking on it in the left hand panel of the notebook, then second selecting “Publish Dataset” in the three dot menu on the top of the page next to the dataset name. This dataset can now be seen in ThoughtSpot and used in ThoughtSpot liveboards and Spotter which will all be shown next.
ThoughtSpot liveboard
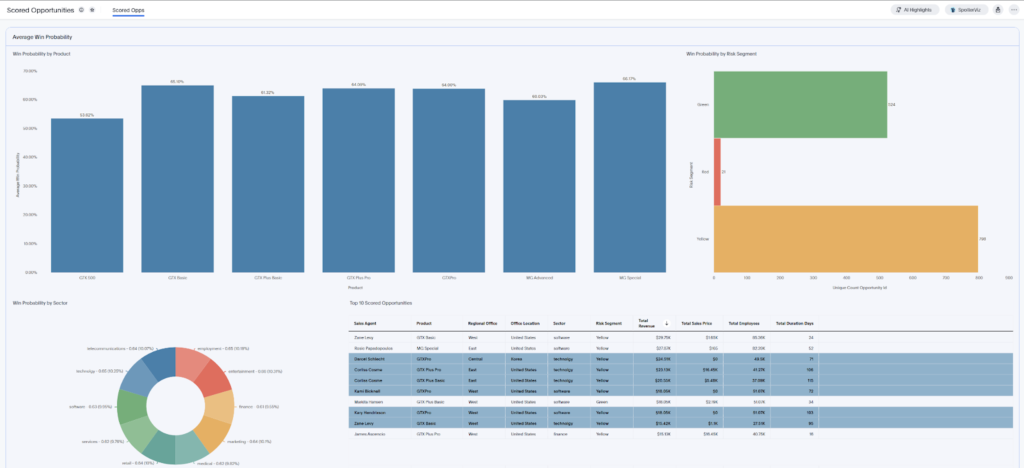
While Spotter allows for on-the-fly, conversational deep dives, the liveboard serves as the permanent “Command Center” for the sales organization. It takes the win probabilities and risk segment outputs from our model, and pins them into an interactive dashboard. Looking at our liveboard, we can see the model’s logic visualized across the business:
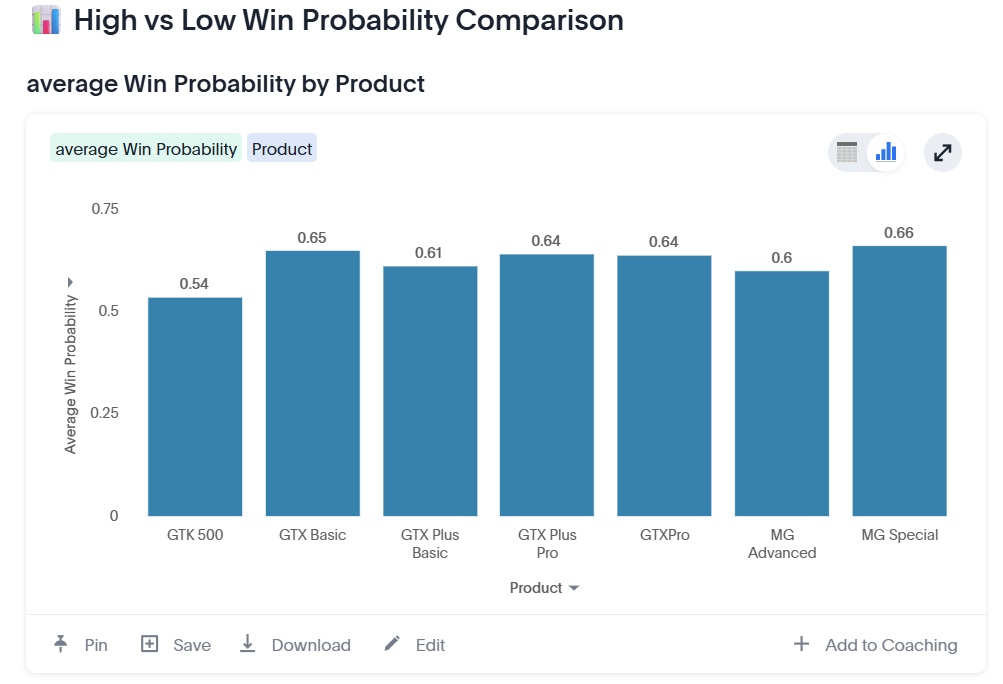
- Win Probability by Product: We can instantly identify which product lines are seeing the highest predicted probability of conversion, allowing the team to double down on what’s working.
- The Risk Segment Breakdown: The horizontal bar chart provides an immediate visual of the pipeline’s health. By categorizing deals into Green (Low Risk), Yellow (Medium Risk), and Red (High Risk), managers can prioritize their time. A large “Yellow” segment, for example, might represent a massive coaching opportunity to move those deals into the Green.
- Sector and Agent Performance: The donut chart and “Top 10 Scored Opportunities” table allow for granular filtering. If a manager wants to see why a specific rep has a high volume of “Yellow” deals, they can click directly on that agent’s name to filter the entire liveboard and see the underlying data.
The true power of a ThoughtSpot liveboard is that it isn’t a dead-end. If an executive sees a dip in the “Win Probability by Sector,” they don’t have to call an analyst. They can simply click the “Explore” button or use Spotter directly from the chart to ask their next question.
Spotter demo
The power of using a ThoughtSpot Notebook comes in the ability to write back the scores to ThoughtSpot to use the Spotter functionality. The model output (WIN_PROBABILITY and RISK_SEGMENT (red, yellow, green based on score)) can be leveraged in ThoughtSpot’s AI-powered analyst, Spotter. Spotter can then interact with questions from users to show patterns, provide explanations, and suggest recommendations. This allows managers and reps to understand what the scores are telling them and how to increase their win rates.
In these next sections, we will walk through different prompts given to Spotter based on the model’s opportunity scores and the answers provided.
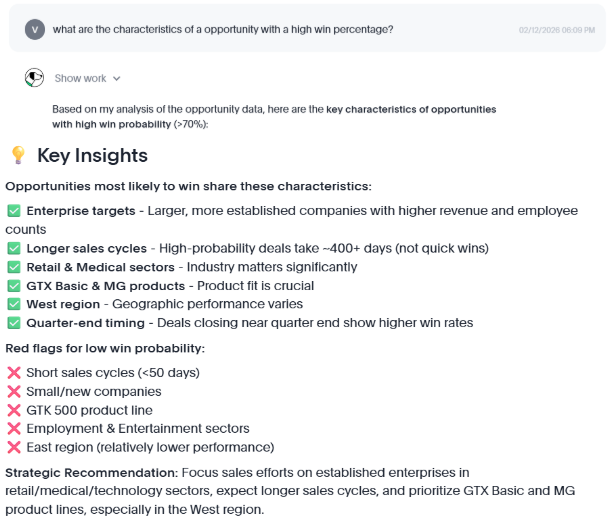
Scenario A: The executive view
Executives need to know at a high level what is driving success. They can ask Spotter: “What are the characteristics of the opportunities with the highest win probability?” The response provides visualizations and KPIs with key insights into opportunities. Executives can see what part of the business is doing well and what is not working well. Spotter provides visualizations for easy comparison and recommendations for focus areas.
Below are screenshots of the interaction with Spotter:
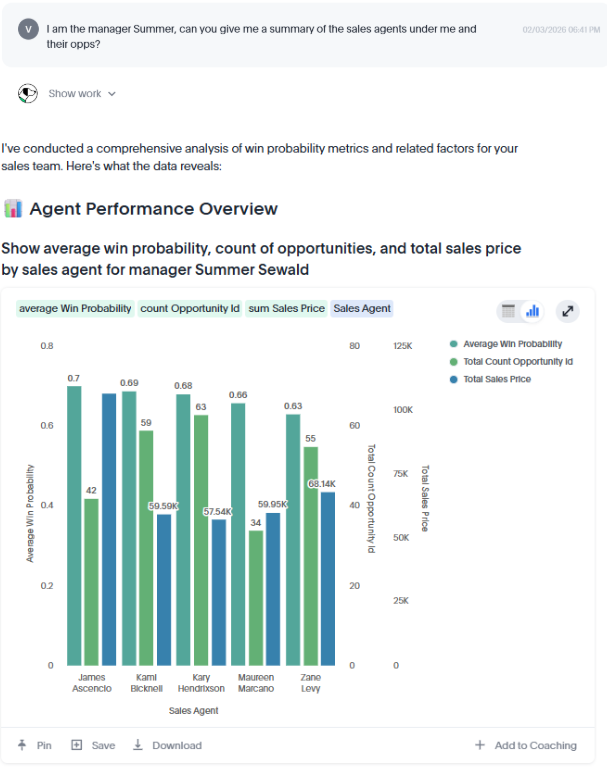
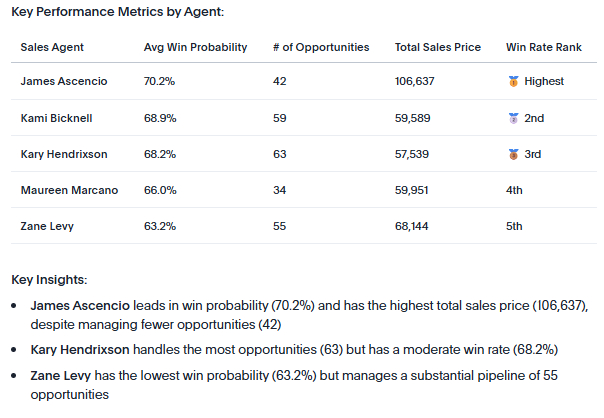
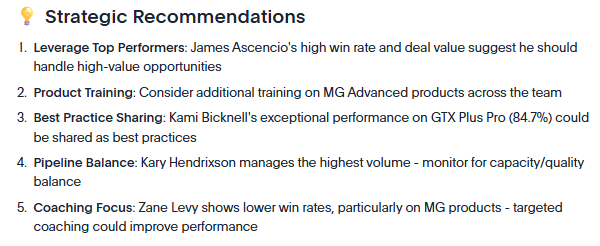
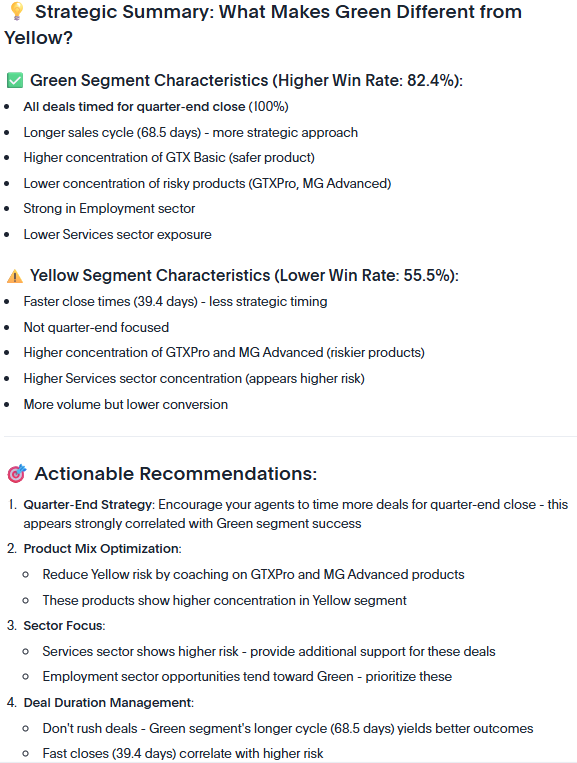
Scenario B: The sales manager view
Sales Managers are more interested in knowing how their team is performing and how to provide coaching to improve performance. They can ask Spotter: “Can you give me a summary of the sales agents under me and their opportunities?” or “Can you summarize the characteristics of the opportunities for green vs. yellow for my agents?” The response provides a bar chart and table with a summary of the sales manager’s team for a quick look and comparison between those they manage. Spotter also provides strategic recommendations for areas agents with lower predicted win rates can focus on based on what has worked in the past.
Below are screenshots of the interaction with Spotter:
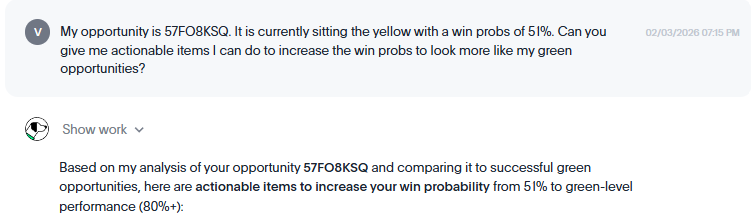
Scenario C: The rep view
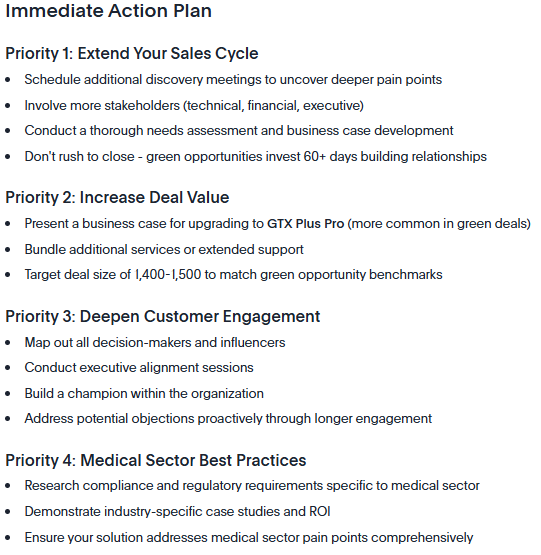
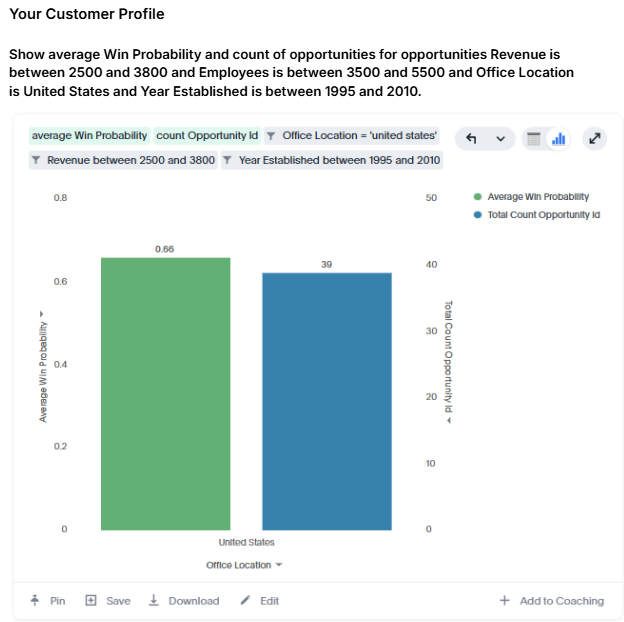
An individual rep would be interested in understanding more about the score of a particular opportunity and what they can do to increase the win probability. They can ask Spotter: “Can you give me actionable items I can do to increase the win probability of my opportunity?” The response provides a prioritized action plan that the rep can implement. Spotter also provides a bar chart to understand the average win rate for other opportunities that are similar to their own to provide insights on how they are doing in comparison.
Below are screenshots of the interaction with Spotter:
Notebook and Spotter
What makes this process truly transformative isn’t just the sophisticated modeling—it’s the fact that the entire journey happens within a single, unified workflow. In traditional data science processes, joining data, modeling, and surfacing results all happen in different environments. Whereas in ThoughtSpot, the Python logic of joining tables like Opportunities, Accounts, and Products resides in the same platform as the end-user dashboard without the need for additional tools.
Once the Notebook has generated its outputs, Spotter serves as the universal interface. A raw probability score is just a number; without context, it doesn’t drive improvements. Spotter turns that score into a conversation and provides deep insights. Because Spotter understands everyday language, it allows any user to interrogate and understand the model results and take action.
While our focus has been on predictive scoring, the synergy between Notebooks and Spotter opens the door for Exploratory Data Analysis (EDA). Before a model is even written, the Notebook and Spotter acts as a powerful lens for deep data analysis. Data scientists can use these tools to visualize current trends, note outliers, and uncover the behavioral patterns that will eventually inform the model. This pre-scoring phase ensures that the business logic we build is grounded in a thorough understanding of the current sales landscape.
Ultimately, this unified approach removes the friction between “data science” and “doing business.” By bringing EDA, modeling, and search-driven analytics into one environment, we aren’t just finding answers faster; we are ensuring that every piece of complex back-end logic is directly tied to a revenue driving decision on the front end.
Turn a complex Python script into a simple conversation
In the fast-paced world of sales, insights are only as valuable as they are actionable. Throughout this walkthrough, we’ve seen how the traditional barriers between data science and business execution can be dismantled using a single, unified platform. By starting in the ThoughtSpot Notebook, we moved beyond generic metrics to engineer features like deal velocity and seasonality tailoring our predictive logic to the unique pulse of the sales cycle. We moved from “black box” modeling to a transparent, “champion” model selection process that the entire business can trust.
But the real magic happens when that technical complexity is handed over to the people on the front lines. Through Spotter, we’ve seen how an executive, a manager, and a rep can each find the specific answers they need to grow their pipeline and increase win rates all through natural language.
In the end, this workflow allows you to turn a complex Python script into a simple conversation. By democratizing advanced data science, you ensure that your pipeline is no longer a mystery to be solved by a siloed analytics team, but a clear, searchable roadmap to a record-breaking quarter. The whole process is done in a single system without having to wait for changes to happen from other teams in other systems. The control is also in one place to build a predictive model, liveboard, and use Spotter all within ThoughtSpot.
