

ThoughtSpot Deep Dive: Conversational Analytics for Real-Time Insights
Across the business intelligence space, there are dozens of different solutions to serve your analytics needs. With the advent of AI and Agents integrated into all of our technology, each tool has found its strengths and weaknesses. ThoughtSpot has established its niche through conversational analytics and dynamic, live dashboard build.
Let’s explore just where ThoughtSpot fits within the analytics space, and how it can improve your analytics capabilities.
What is ThoughtSpot?
ThoughtSpot is a pioneer of conversational analytics. Through ThoughtSpot, users are no longer bound by the development of existing dashboards and visuals. Instead, users are able to develop and create analytics dashboards by using natural language to develop visuals, filters, and tables that they can then add to ThoughtSpot “Liveboards,” ThoughtSpot’s version of dashboards. These are so called “Live” because all the data visualized in ThoughtSpot is intended to be a live copy of the data source. By querying the cloud data warehouse directly, ThoughtSpot ensures that the moment a record is updated in your source, it is available for analysis, effectively ending the era of stale, scheduled data extracts. As long as your data source is up to date, ThoughtSpot can read that information readily.
Data models
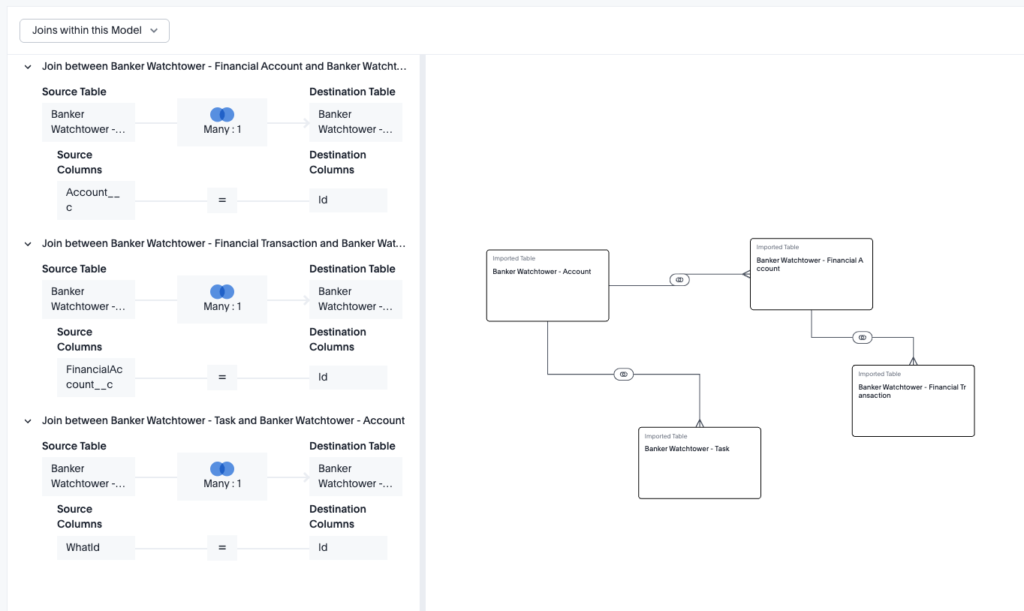
We all know that any BI tool starts with one thing: the data. In ThoughtSpot, Data Models are the name of the game. With connections to nearly every ETL tool, like Snowflake, Databricks, BigQuery, and more, ThoughtSpot can match nearly every other BI tools data connectivity capabilities. Once connected to the data, tables can be joined and related together to develop a data model. These data models then allow for users to develop liveboards, and Spotter search configurations, with different data across different data tables.
While you won’t be using ThoughtSpot to develop complex data transformations, data models are intended as the backing for the visuals and search that makes ThoughtSpot so powerful.
Liveboards
While traditional BI tools use “dashboards” as static displays of pre-defined metrics, ThoughtSpot uses Liveboards. As the name suggests, these are interactive, real-time collections of your “Answers” (saved natural language searches as visualizations). These answers can come from natural language search or Spotter (more on that later).
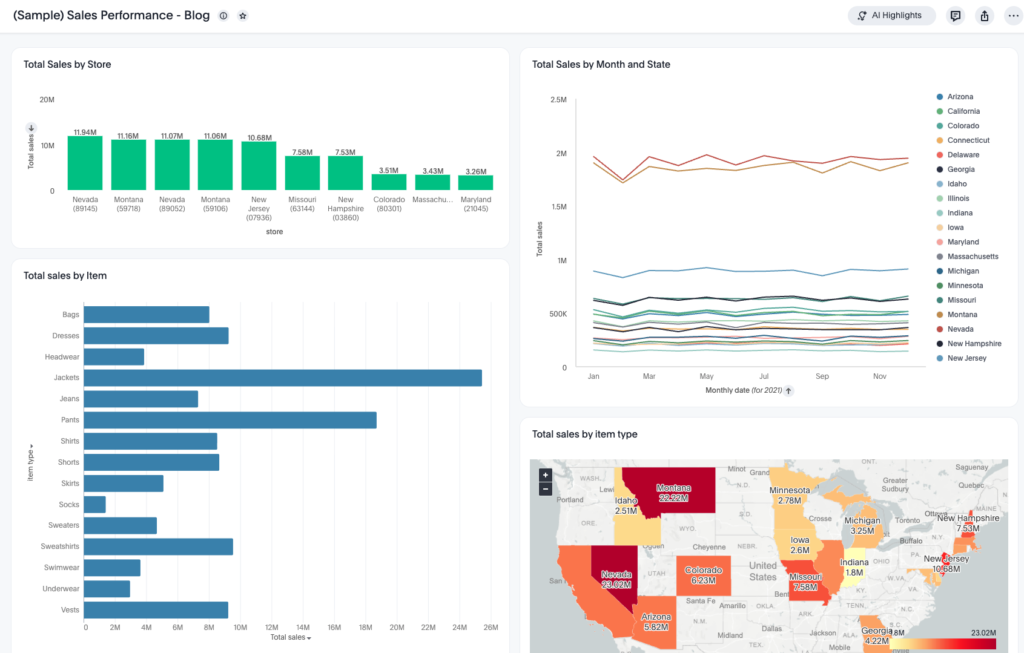
The power of a Liveboard lies in its flexibility. Instead of just looking at a chart, users can right-click any data point to Drill Anywhere. This means you aren’t confined to a pre-built drill path; you can break down a sales spike by store, then by product, and then by individual customer—all within the same interface. This turns a passive viewing experience into an active exploration session. That’s even without the natural language search found with Spotter!
ThoughtSpot also features dozens of visuals built-in, and ready to use. These visuals include your traditional bar, pie, and line charts, but also more complex visuals like maps, heatmaps, and the long-awaited Sankey chart. ThoughtSpot liveboards have enough visuals to match nearly every other BI tool, while also putting the focus on the Natural-language search capabilities of the tool.
Spotter
Spotter is arguably the most important feature of ThoughtSpot that separates it from other analytics solutions. ThoughtSpot brands this feature as your AI-powered analytics assistant. Spotter isn’t just a chatbot, it is a reasoning engine that understands the context of your data.
Whether you are starting from a blank page or looking at a complex Liveboard, you can simply ask Spotter a question like, “Why did our churn rate increase in the Northeast last month?” Spotter will analyze the underlying variables, identify the primary drivers, and generate the necessary visuals to explain the “why” behind the “what.” It effectively gives every user the power of a personal data analyst. Beyond this, users are also prompted with “AI Insights” to explore anomalies, trends, and pain points that they can expand upon with Spotter, all on the dashboard itself.
Your analysts will be responsible for configuring Spotter with data models that utilize your real-time data, semantic knowledge to ensure Spotter is optimized for all of your organization’s terminology, and reference questions that prepare the model for all kinds of requests. Spotter transforms your analysts into data modelers, and architects, who no longer have to spend time developing ad-hoc dashboards. Instead, they can configure Spotter once, and focus their time on more complex tasks like data models, and predictions in Analyst Studio.
Analyst Studio
For the data experts, Analyst Studio is the command center. This is where the magic of the semantic layer happens. It allows analysts to govern how data is presented to the business, ensuring that when a user searches for “Revenue,” they are getting the true, verified calculation. But we could do all that in ThoughtSpot Data Models, so what makes Analytics studio different?
Analyst Studio introduces a notebook-style environment that supports SQL, Python, and R. This allows analysts to perform complex data transformations and advanced statistical modeling directly within the platform, bridging the gap between deep data science and self-service business intelligence.
Rather than relying on your data science or engineering team to develop predictions, and transformations, Analyst Studio allows analysts to perform this type of analysis directly within ThoughtSpot. The output of these predictions and scripts can be added to data models, which can be used to make your liveboards and Spotter even more intelligent.
When should I use ThoughtSpot?
ThoughtSpot shines in environments where speed to insight and ad-hoc curiosity are priorities. You should consider ThoughtSpot when:
- Your data is in a modern cloud warehouse: It is built to leverage the compute power of platforms like Snowflake, Databricks, and BigQuery.
- Dashboard backlogs are mounting: If your data team is overwhelmed by “small change” requests (e.g., “Can you add a filter for Region?”) ThoughtSpot can offload that work to the users with Spotter and its natural language search.
- Live data: When waiting for an overnight refresh isn’t an option for your operations.
- Your Analysts are ready for more: Your analysts are statistics-savvy and can expand beyond BI build toward data science and predictions.
Who are the intended users of ThoughtSpot?
All types of users should be in ThoughtSpot, but there is a key highlight on specific types of users:
- Executive Leadership: For high-level KPIs that they can interrogate on the fly during meetings without needing a technician present to answer their data questions.
- Front-line Managers: For operational teams (Sales, Marketing, Supply Chain, etc.) who need to answer specific, granular questions to make daily decisions.
- Data Analysts: For the “Builders” who want to spend less time on repetitive reporting and more time on high-value data modeling and governance. The introduction of Analyst Studio also elevates your data analysts from just BI developers to Data Scientists and Engineers, all without leaving ThoughtSpot.
A fundamental shift from “data consumption” to “data Conversation”
By moving away from static charts and toward a search-driven, AI-augmented experience, organizations can finally democratize their data in a way that is both governed and accessible. Reach out to discuss how to get the most out of your ThoughtSpot implementation.
