It’s 5 PM on a Friday. Your Slack just Buzzed.
ThoughtSpot Spotter has the answer before you even panic.
The most dreaded moment in analytics isn’t a bad dashboard. It’s a good one that nobody looks at.
You’ve built the reports. You’ve set up the access. And yet, every time a decision needs to be made, someone fires off a Slack message asking you to pull the numbers. Because the dashboard is “over there,” and the conversation is right here.
That gap between where data lives and where teams actually work has always been the quiet killer of data-driven culture. Most BI tools have tried to solve it by making dashboards prettier. ThoughtSpot took a different approach: they put the analyst inside Slack.
With Spotter – ThoughtSpot’s AI analytics agent – now natively integrated into Slack, your team can ask any data question in plain English, directly inside a channel, and get a chart-backed answer in seconds. No SQL. No tab-switching. No ticket to the analytics queue.
“Why did the win rate % drop in August?” – typed into Slack. Answered by Spotter in under a minute.
That’s not a demo scenario. That’s a real conversation happening right now in Slack channels across teams using ThoughtSpot. Let me show you exactly how it works, and why it matters.
The Problem: Data has always been one step away and that step is too far
Ask any data analyst what their biggest pain point is, and you’ll hear a familiar story. Business teams want answers fast, but the data lives somewhere else in a portal you have to log into, a dashboard last refreshed three hours ago, or a report that only the analyst knows how to filter correctly.
The friction isn’t just inconvenient. It’s expensive. Studies consistently show that the majority of enterprise data goes untapped not because it doesn’t exist, but because accessing it requires more effort than the question seems worth.
Here’s the part that stings: even when organizations invest in world-class BI tools, the real conversations about data still happen in Slack. In meetings. In “can you quickly pull…” messages. The tool is one window, the work is in another, and every context-switch is friction that compounds over time.
The insight is only useful if it reaches the person who needs it, at the moment they need it.
ThoughtSpot built Spotter to close that gap entirely.
What is ThoughtSpot Spotter?
Spotter 3 – launched in late 2025 – took this even further. It now connects not only to structured data in your warehouse, but also to unstructured context from tools like Slack, Salesforce, and Jira. So when you ask “Why did win rate drop in August?”, Spotter isn’t just running numbers – it’s pulling in the surrounding conversations and records that explain the story behind them.
What makes this especially powerful is how little effort it takes to get started. Unlike traditional BI tools that require extensive data modeling, training, or dashboard building, Spotter 3 can begin delivering insights almost immediately – even from messy, unstructured data sources.
Spotter doesn’t just tell you what happened. It tells you what happened, why, and what to look at next.
And now, it does all of that without ever leaving Slack.
How Spotter + Slack integration works
The setup is simpler than most people expect. Here’s the complete picture:
- Enable the integration: Contact ThoughtSpot support to activate the Slack app for your ThoughtSpot instance.
- Install the ThoughtSpot app in Slack: Find it in the Slack App Directory and add it to your workspace.
- Add Spotter to a channel: Invite it into #sales, #revenue-ops, #exec-updates – wherever your team makes decisions.
- Pin a data model: Select a Worksheet or Model to pin to the channel. This tells Spotter which dataset to query. Click Pin Model.
- Start asking: Type @Spotter followed by any question in plain English. Or use /spotter help for quick one-off queries.
The experience from there is remarkably natural. Ask a question, Spotter processes it, and returns a chart inside the thread. Follow-up questions stay in the same thread – Spotter maintains context, so you’re having a real conversation, not starting from scratch each time.
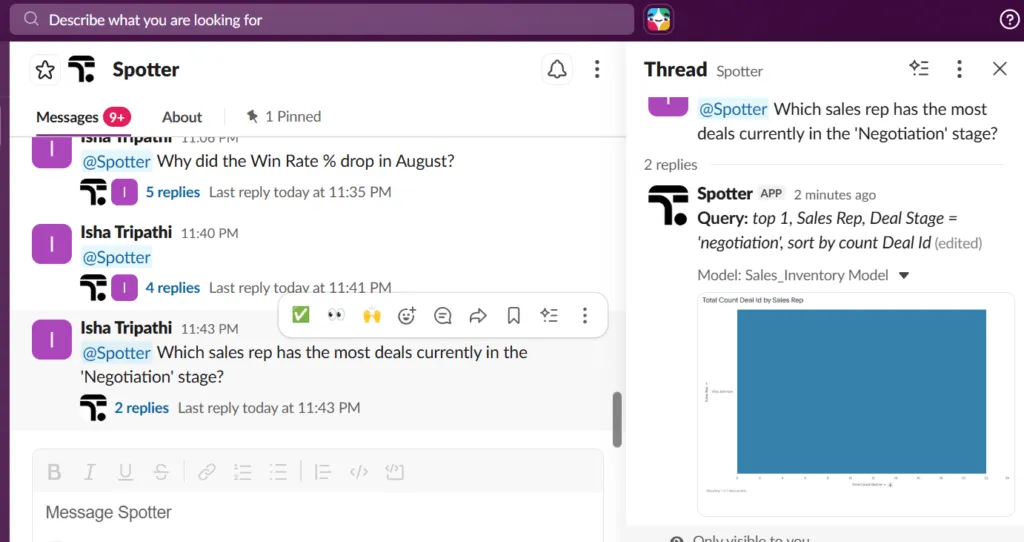
Notice the screenshot above: real questions, asked in plain English at 11 PM, answered with structured data visualizations right inside the Slack thread. Follow-ups stay in the same conversation. No dashboard tab. No analyst ticket. Just answers.
All of this sounds great in theory – but the real impact becomes obvious when you see it in action.
Here’s what it actually looks like when a simple Slack message turns into a chart-backed answer in seconds:
What’s happening here is deceptively simple:
- A question is asked in plain English – no technical syntax
- Spotter understands the intent and context instantly
- A ready-to-use chart is generated – not raw data, but an actual answer
This is the shift: from asking someone for data… to simply asking for answers.
Who benefits and how
The Spotter + Slack integration isn’t one-size-fits-all. It delivers specific, meaningful value to every team that touches data – which, let’s be honest, is every team.
Sales & RevOps teams: Sales cycles move fast. Pipeline reviews happen in Slack before they happen in slides. With Spotter pinned to your revenue channels, anyone can pull deal counts by stage, rep performance, forecast accuracy, or revenue by region – right inside the conversation. No waiting. No stale numbers.
Data & BI analysts: Here’s the truth most vendors won’t say out loud: Spotter doesn’t replace analysts. It handles the repetitive ad-hoc questions so analysts can stop being a human query machine and start doing the high-value work that actually requires their expertise.
Business executives: Executives check Slack. They do not check dashboards. Spotter meets them exactly where they already are. Ask a strategic question during a live planning conversation, get a chart-backed answer on the spot. Data becomes part of the discussion – not something you circle back on later.
Everyone else: The deeper signal: when data answers live in Slack, everyone becomes a data user. Not just the people with BI tool licenses. The entire organization.
The bigger picture: Agentic Analytics is here
The Spotter + Slack integration is a feature. But it’s also a signal about where enterprise analytics is going – and how fast.
Traditional BI was passive. You went to the data. You opened the dashboard. You built the report. The insight was the destination.
Agentic analytics – what Spotter 3 represents – is the opposite. The insight is the starting point. Spotter validates its own assumptions, surfaces anomalies you didn’t ask about, and works across both structured and unstructured data – without requiring heavy upfront setup or continuous model training. It reasons like an analyst. It just happens to live in your Slack channel.
In the old model, data was a department. In the new model, data is infrastructure – and Spotter is the interface.
For organizations working with Atrium to build out their analytics strategy, this shift is exactly what we help clients prepare for. Making sure your data infrastructure, your team workflows, and your tooling are all ready for an AI-first world isn’t a future project – it’s happening right now.
The bottom line
Here are the three things to take away:
- Data should find your team – not the other way around. Spotter in Slack puts answers where decisions are actually made.
- Self-serve analytics is finally real. When anyone can ask a question in plain English and get a chart back in seconds, “data-driven” stops being a buzzword.
- Agentic analytics isn’t coming. It’s here. Spotter 3 is available today – and so is everything it can do inside your Slack workspace.
Next time it’s 5 PM on a Friday and your Slack buzzes with a data question – you’ll know exactly what to do.
Curious how ThoughtSpot Spotter fits into your team’s analytics stack? Atrium can help you figure that out – before the next 5 PM ping catches you off guard.