Consumption Forecast vs Actuals: Account View
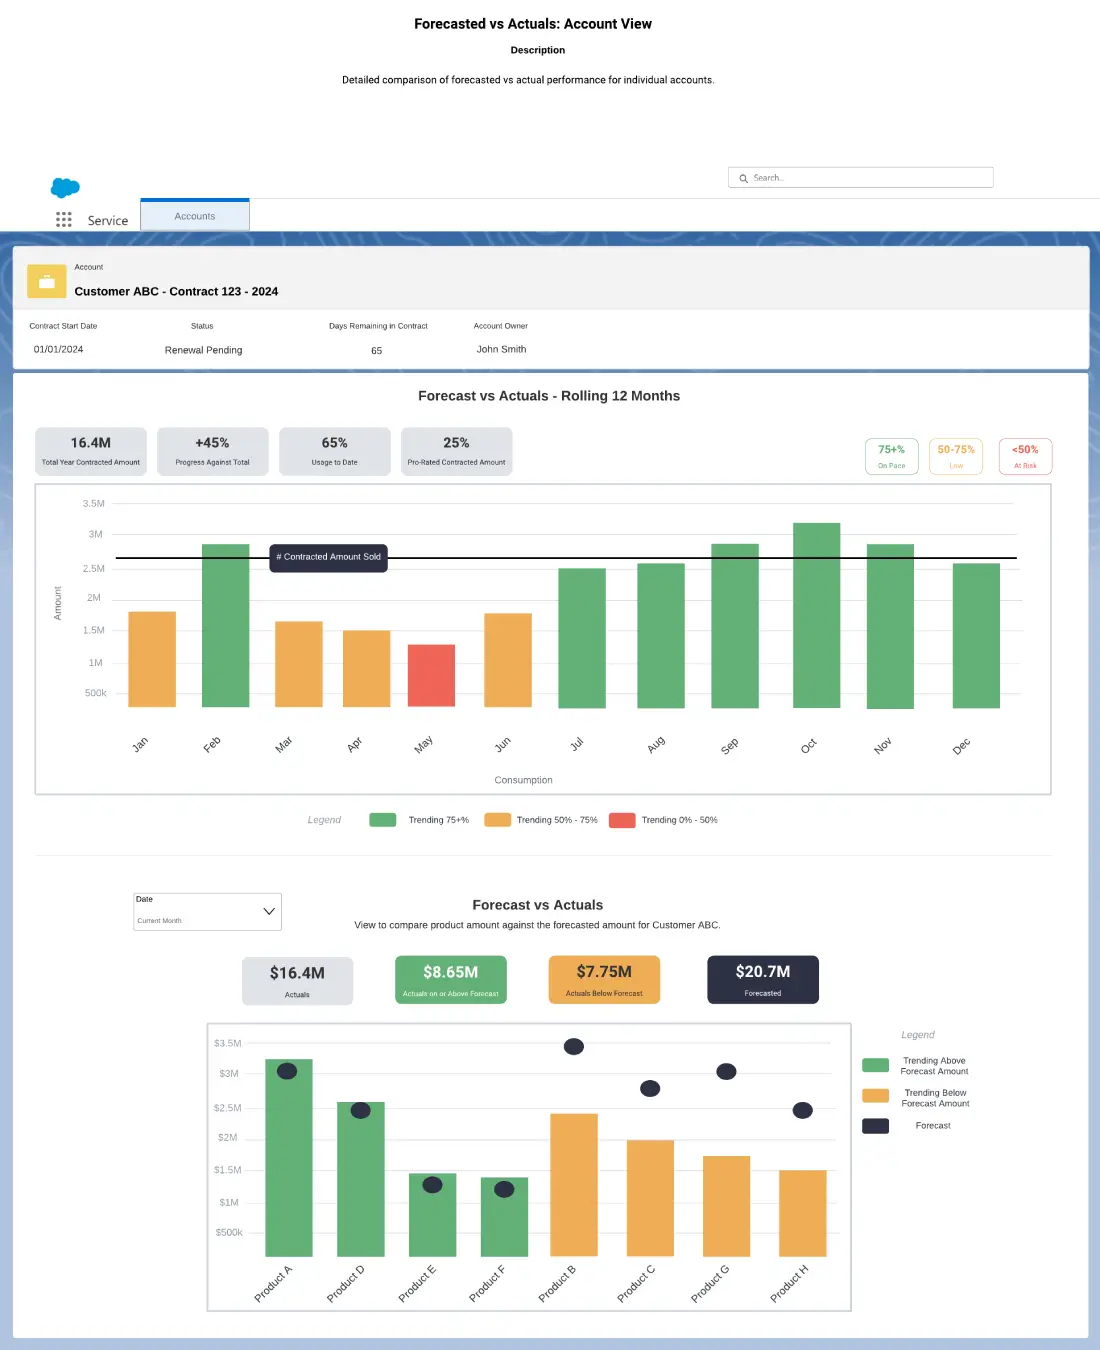
See a detailed comparison of forecasted vs actual performance for individual accounts with a chart showing overall performance for the account (top) and a second chart showing product-by-product data (bottom). This can be embedded as a Lightning Web Component on the Account record for easy access.
Ready for Real Results?
Reach out to our team—dedicated to the metrics that matter most. We’re here to help you adapt and grow.