




Spotter Builds the Model. Analyst Studio Makes It Stick.
TLDR/key takeaways:
- ThoughtSpot Spotter predictive models, such as a random forest built from a single chat prompt, give business users a fast, directional read on what drives an outcome without writing code.
- In an Atrium test, Spotter built a 100-tree random forest in seconds and scored a 1,343-opportunity holdout set at 62.5% precision and 71.1% recall.
- Spotter’s chat-built models do not write scores back to a ThoughtSpot Data Model or rescore on a schedule, so they suit exploration rather than production.
- ThoughtSpot Analyst Studio Notebooks turn the same idea into a governed scoring pipeline: a scheduled Report reruns the model, and published outputs feed Liveboards and Spotter.
So when is a chat-built model enough, and when do you need a Notebook?
Every business question eventually becomes a numbers question. Dashboards report what already happened; predictive analytics estimate what is likely to happen next. That shift, from reporting on the past to predicting it, is where the competitive edge sits.
ThoughtSpot now offers two routes to that edge. In our first Analyst Studio post, we showed the Notebook route: data science teams use Python to engineer features, train machine learning models, and publish predictive scores like win probabilities into a Data Model that Liveboards can read.
The second route is newer. ThoughtSpot Spotter predictive models are built in conversation. Spotter 3 added Python coding and forecasting, so you can ask ThoughtSpot’s conversational AI agent which deals will close, and it writes and runs its own logic, no Notebook required. So where does that leave the Notebook-built approach? Below, we test Spotter’s built-in modeling, weigh its trade-offs against a structured data science pipeline, and show how to combine both.
What can ThoughtSpot Spotter predictive models do?
Spotter gives business users conversational access to machine learning without writing code. Where Analyst Studio is a dedicated environment for data science teams to write, run, and govern production models, Spotter acts as an agentic analyst: it writes and executes Python behind the scenes to answer predictive questions on the fly. ThoughtSpot documents Spotter’s forecasting and correlation analysis, and in our testing it also handled classification and feature importance from a plain-language prompt.
Without leaving the conversation, a non-technical user can ask Spotter to run:
- Classification models (for example, random forest): evaluate historical deal traits to estimate outcomes like win or loss.
- Regression and forecasting: project deal size, cycle length, or revenue.
- Feature importance: rank which business drivers carry the most predictive weight.
- Feature engineering guidance: recommend calculated fields such as deal ratios, seasonality flags, and interaction terms that could improve a model.
Spotter in action: the opportunity conversion workflow
To see how Spotter handles a predictive task, we gave it this prompt against opportunity data in a ThoughtSpot model:
“Develop a model that identifies what opportunities are most likely to convert using random forest. Leave 20% of opportunities out for testing then create a likelihood score for each of those opportunities.”
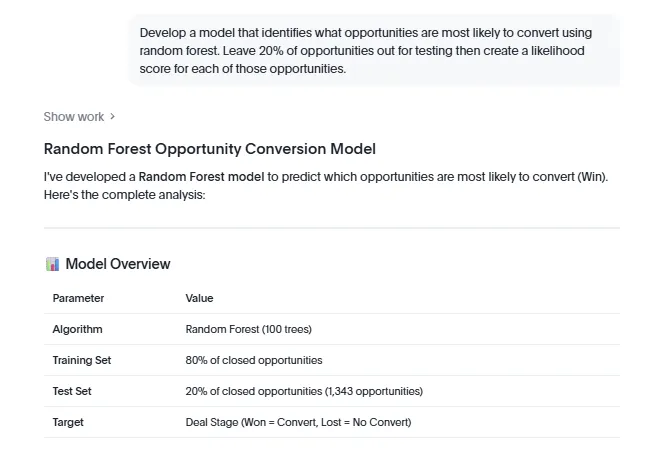
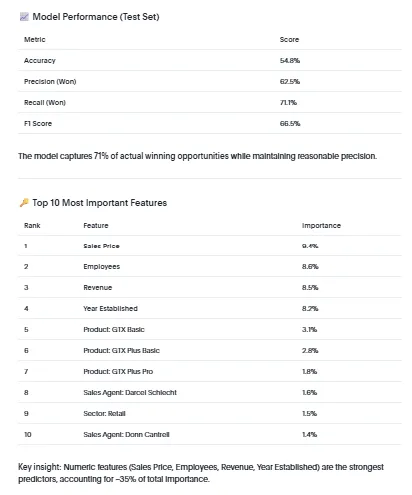
Spotter built a 100-tree random forest classifier on 80% of closed historical deals and tested it against a 20% holdout set of 1,343 opportunities. Within seconds, it returned a layered read:
- Baseline performance: 54.8% accuracy, 62.5% precision, and 71.1% recall. In practice, when Spotter flags a deal as a likely win, it is right about 6 times out of 10 (precision), and of the deals that actually win, it spots about 7 out of 10 in advance (recall).
- Key predictors: Sales Price (9.4%), Employees (8.6%), Revenue (8.5%), and Year Established (8.2%) together account for over a third of total model importance.
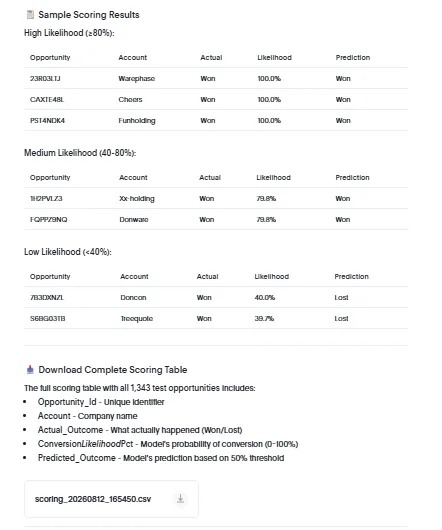
- Scored, exportable output: Spotter grouped the test set into High, Medium, and Low likelihood tiers and offered all 1,343 scored records as a CSV download.
Where Spotter’s models stop: exploration vs. production
Spotter’s built-in modeling is a low-friction tool for testing hypotheses and discovering drivers, not a production pipeline. In a single chat session, a business leader can test a hunch, identify key pipeline drivers, and surface patterns worth a closer look.
Push that chat response into a production role, though, and three constraints appear (as of this writing):
- No write-back to governed Data Models: Spotter does not write its likelihood scores, probabilities, or suggested features back into a ThoughtSpot Data Model. Predictions stay in the chat session or a local CSV, out of reach for the rest of the organization.
- No automated rescoring: Spotter does not run background scoring jobs against live warehouse data. Scoring next quarter’s pipeline means someone prompts it again.
- Governance and reproducibility gaps: because Spotter reasons fresh with each prompt, it lacks the version control, hyperparameter tuning, and threshold management that keep a model consistent and audit-ready over time.
Spotter excels at answering “What drivers matter right now, and what does a baseline look like?” Turning those directional insights into an automated, repeatable, governed model takes the programmatic control of Analyst Studio.
Why production predictive models belong in Analyst Studio
Moving from an exploratory model to a trusted operational workflow raises three questions: governance, live versus historical performance, and risk. Production models need version control so the same algorithm scores consistently over time. Models trained on closed historical snapshots need rigorous evaluation before they score a live, active pipeline. And untuned baseline models can produce risky false positives, such as a 100% win likelihood on a high-value deal that ultimately loses. Managing those edge cases takes a data scientist tuning hyperparameters, adjusting thresholds, and revalidating as the business changes.
Analyst Studio brings data science into ThoughtSpot
That is where Analyst Studio earns its place. Every Analyst Studio Report includes a Notebook that runs Python or R on the results of SQL queries against your warehouse, with libraries like pandas and scikit-learn preinstalled. A data scientist can take the features Spotter suggested (deal velocity, seasonality, account win rate) and build a custom, defensible model without moving data off the platform.
Creating and scoring the model
Building a predictive model in Analyst Studio comes down to four stages:
- Ingestion: query active pipeline tables in the data warehouse.
- Feature engineering: build business-specific features that reflect your actual sales cycle.
- Training and champion selection: train candidate algorithms side by side and keep the best performer, with logic that is explicit and repeatable rather than reasoned fresh with each prompt.
- Batch scoring: include the Notebook output in a Report so the Report’s schedule reruns the Notebook and keeps scores in sync with the live pipeline.
One honest caveat: repeatability only holds if someone tracks it. ThoughtSpot’s Git version control covers Liveboards and Answers, not Notebooks, so nothing stops the underlying logic from being edited with no record of what changed. Proving which exact version scored last quarter’s pipeline is still on the data science team to build.
Publishing outputs to a ThoughtSpot Data Model
A custom model produces structured outputs: prediction probabilities, risk tiers, and key driver metrics. Analyst Studio can export Notebook output to ThoughtSpot as a dataset, and published datasets work as a source for Liveboards and Spotter like any other table, so you can bring them into the Data Model your teams already use. That step turns custom modeling into something the rest of the business can act on.
How Analyst Studio, Liveboards, and Spotter work together
ThoughtSpot is most valuable when Analyst Studio, Liveboards, and Spotter run as one loop. Analyst Studio produces the models, Liveboards keep them in view, and Spotter explains them in plain language. Each works alone; together they form a feedback loop.
Here is how it plays out. A model built in Analyst Studio scores every opportunity with a win probability and a Green, Yellow, or Red risk tier. Those results are published into a ThoughtSpot Data Model, where they power Liveboards and can be explained on demand by Spotter, including inside Slack: an executive comparing win rates by product, a manager coaching a rep out of the Yellow tier, or a rep asking what would move their own deal into Green. The scores stop being static exports someone has to interpret and become fields Spotter can query and explain.
The loop also keeps insights open. Spotter can test correlations the original model never considered without anyone rebuilding the model, and before a model is trained, it can explore the raw pipeline to show what actually drives behavior. And Spotter’s forecasting gets more useful with a calibrated score to work from, catching a slow drift in a rep’s performance rather than just counting open deals.
A chat answer is a one-off by nature. Pinning these outputs to a Liveboard turns them into a standing command center that refreshes on its own. Row-level security and Liveboard permissions control who sees which deals or territories, and scheduled Liveboards can email a weekly “who moved from Green to Yellow” digest to a manager who never has to open ThoughtSpot. That is how a good answer becomes a governed asset the organization runs on every day.
Gut check or scoring pipeline: when to use each
Spotter is the quick gut check; a Notebook-built model is the live scoring pipeline. They are not competing approaches. The Notebook-built model is the deliberate, feature-engineered, governed version of the same idea Spotter sketches in seconds.
Use Spotter’s native modeling when you need a fast, directional read: sizing up a new market, sanity-checking a hunch, coaching a rep in the moment. Use a Notebook-built model when the decision is significant enough, and repeated often enough, that it has to survive scrutiny: audited logic, consistent versioning, and a defensible number tied to the Data Model everyone already trusts.
The real payoff isn’t picking one. It’s the loop: Spotter for the first investigation, a Notebook’s score feeding the Data Model, a Liveboard keeping it visible, and Spotter explaining it again to anyone on the team. Teams that build the whole loop will get far more out of ThoughtSpot than teams using any single piece of it alone.
Frequently asked questions
Can ThoughtSpot Spotter build predictive models?
Yes. Spotter 3 can write and run Python inside a chat, and ThoughtSpot documents its forecasting and correlation analysis. In Atrium’s testing, a single prompt produced a 100-tree random forest that scored a 1,343-opportunity holdout set and sorted it into likelihood tiers.
Can Spotter save model scores to a ThoughtSpot Data Model?
Not on its own, in Atrium’s testing. Spotter’s scores stay in the chat or a CSV export. To make scores available across Liveboards and Spotter, build the model in an Analyst Studio Notebook and publish its output to ThoughtSpot as a dataset.
How do you schedule a predictive model in ThoughtSpot?
Include the Notebook output in an Analyst Studio Report. The Report’s refresh schedule reruns the Notebook, so model scores stay in sync with the latest pipeline data.
Are Analyst Studio Notebooks version controlled?
Not through ThoughtSpot’s Git integration, which covers Liveboards and Answers. Teams need their own process for tracking Notebook logic so they can prove which model version produced a given score.