Activity Tracking: Easily Identify Trends (Tableau)
View activites across a variety of dimensions and spot trends over time.
Metrics Leaderboard (Tableau)
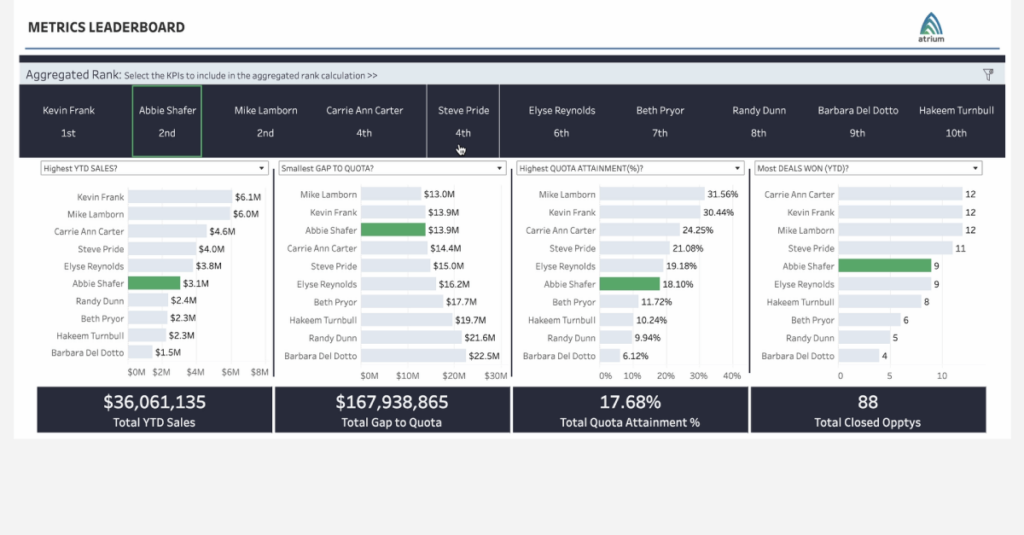
See how your team is tracking in aggregate and across nine different metrics.
Booked+Weighted Pipeline vs Quota (Tableau)
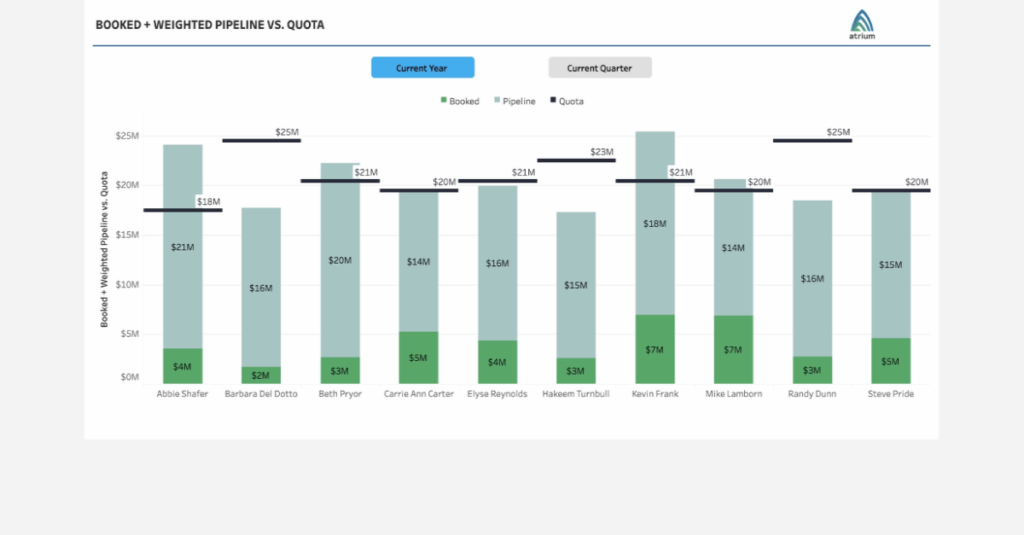
Show progress towards Quota Attanment via a stacked bar side-by-side with a solid bar.
Pipeline Shortfall: Identify and Track (Tableau)

Track a rep’s projected progress vs. their quota, while identifying how much additional pipeline
Analyzing Pipeline Changes with Revenue Intelligence

With this Revenue Intelligence solution enhancement from Atrium, see monthly pipeline movement,
Pipeline Maintenance Dashboard

Sales reps can view their opportunity pipeline and take action directly in Tableau.
Quota Scoreboard Dashboard

Review progress to quota across the team and highlight specific team members for review.
Metrics Leaderboard (CRM Analytics)

See how your team is tracking in aggregate and across nine different metrics