

How to Embed CRM Analytics Dashboards on Your Website
When we integrate analytics into business processes, we can connect multiple data sources, view or edit reports and dashboards, and toggle features for end users. We can also customize our actions based on customer interactions with dashboards and visualizations. This is known as embedded analytics.
Companies are taking advantage of this and putting the dashboards on their websites, allowing users to interact with them. In this blog, we will look at how to use Embedded Analytics on the Salesforce Platform.
Syncing Data
CRM Analytics enables us to make sense of large amounts of data. We can explore our data to discover new insights and get an instant visualization of the business’ overall performance.
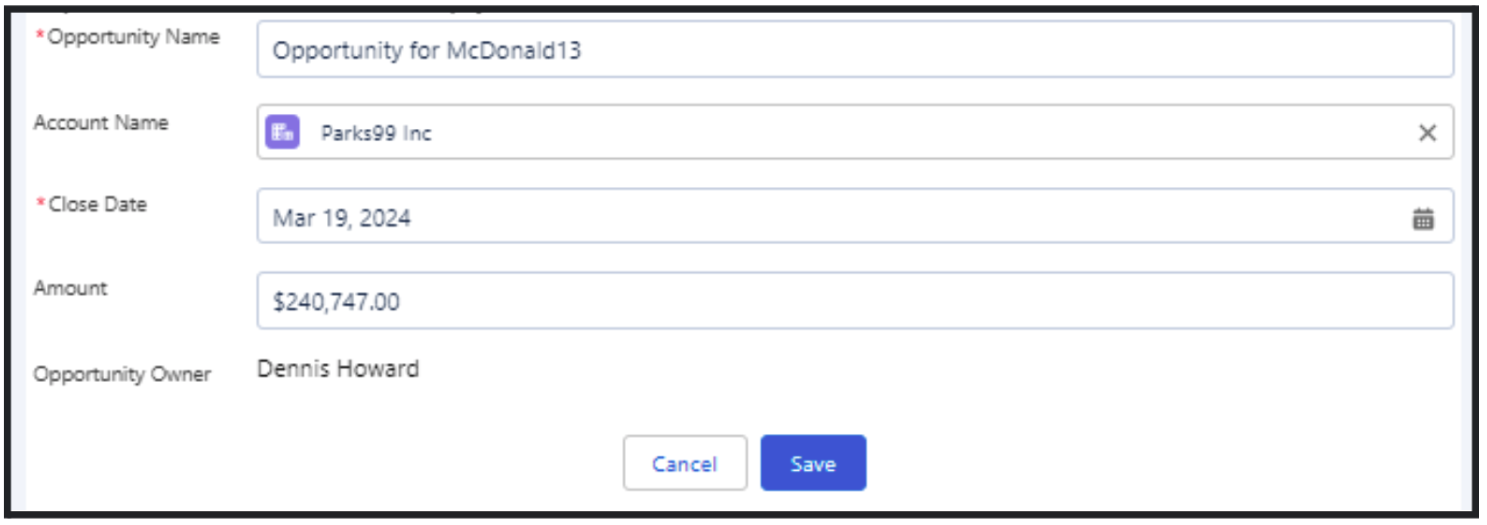
Dashboards are the best way to visualize multiple data reports in one place. Modern dashboards like in CRM Analytics are enabling developers to embed them on their organizations’ websites so their users can access them. The below image is of a record form which can easily be created from a code component and added to a website so a user can easily fill it out.
User interfaces on the Salesforce platform are usually made from Visualforce pages or Lightning web components. Let’s start by looking at how to build this with Visualforce.
If we want to put the dashboard on the website, we have to configure the <wave: dashboard> component. You can add one dashboard per visualforce page, but with the help of links on the dashboard we can access multiple.
|
<apex:page sidebar=”true” > <wave:dashboard dashboardId=”0FK2w000000epYfGAI” </apex:page> |
You’ll need to pass the analytics dashboard’s 18-digit dashboardId to the Wave dashboard component, which you can get from the URL when you view the dashboard. You can pass other parameters such as height to set the screen size, and showTitle to display the dashboard’s title. You can also put multiple other components above and below the Wave dashboard component to make the UI interactive, like adding background, taking input from the user, and clicking on a button to process the action.
Now let’s discuss the basics of Lightning web components, which we can use in CRM Analytics components.
Before starting with the Lightning component, you should know how to connect the Salesforce org with VisualStudio Code.
We first need to install the VS Code package Salesforce Analytics Extension Pack. Next, press ctrl+shift+P and you will see the option SFDX: Create analytics Dashboard LWC.
There are 3-4 files used for creating a simple Lightning web component. We’ll start with the XML file.
|
<?xml version=”1.0″ encoding=”UTF-8″?> |
In the isExposed tag we can set the value as “true” if we want this component to be available on the LWC component of Analytics, and in the target tag we can see that we only kept “analytics__Dashboard” as the target location.
The masterLabel will allow you to set the label of the component. The hasStep tag helps us to import the analytics data, which we further use in the client file and Apex controller to contain the business logic.
The property tag has a public variable that can be used to filter the data as needed. For example, an organization can use a location filter so that users can see nearby hotels available for booking. To do that, we’d use selection binding and put the binding value in the public variable on the analytics LWC component. This variable can be used as a parameter in the controller to show the availability of hotels. We then put the whole dashboard on the user interface by putting a list filter and an analytics LWC component.
The next file we need is a .js file known as the client file.
In this file, we import the LightningElement, decorators such as wire, api, track, static resources, etc.
|
import { LightningElement , api, wire, track } from ‘lwc’; |
LightningElement is a custom wrapper of the standard HTML element. It extends elements to create a JavaScript class for a Lightning web component. The API decorator is used to make variables public, track is used to make the variable reactive, and the wire service is used to fetch the data and fields value. In the second import, we are importing the Apex class method, which will return the cleaned data that we need and pass it to the HTML file for visualization.
|
export default class ClassName extends LightningElement { get stringResults() { this.results != null && this.results.length > 0 ){ else{ |
“Export default class extends LightningElement” is used to create a JavaScript class for Lightning web components. The export default keyword is used to export the method used in “className” class so that it can be used in other components. The code snippet explains that if the “hasStep” tag in the XML file is true, you have to select some data and fields in the analytics and that data is stored in the results variable. From this file we can also call the Apex controller where we write the business logic and fetch the returned data.
Let’s see the Apex controller class and how it is used in the LWC component.
|
public with sharing class ApexClassName{ } else |
Notice that, in the class, the method should be @AuraEnabled, and we can put cacheable=true to help us to improve the performance of the component. The returned data will be stored in the property or method of wired service or with the help of imperative methods in the client file.
The last file used for the user interface is the HTML file.
|
<template> |
Here, stringResults is the data coming from the analytics dataset since we set hasStep to true in the XML file. This is just an example. We can do multiple things with the html like taking input from the user, creating buttons, creating a record form, creating tables, lightning data tables and more.
Finally, let’s see how charts can be used in Lightning components.
There are various options to create a chart on the CRM Analytics dashboards, but by adding the Lighting component in the component section of CRMA we can leverage the JavaScript to add additional chart types on the dashboards. If you see the import snippet, you will see that we are using a static resource JavaScript file and importing as ChartJs.
With the help of this file, we can add eight different types of charts that contain multiple subcharts. For example, for bar charts we can create horizontal bars, vertical bars, or stacked bars. Other charts include radar chart, mixed chart, area chart, etc. You can see more on chart.js’ website.
While adding the charts on the LWC component, we need to configure the chart in the .js file by passing the chart type, data used for the chart, and labels needed for the chart. In the options we can set scale and other chart properties. We also need to import loadScript and loadStyle from the module platformResourceLoader, which will help us load chartJs.
Conclusion
Embedded Analytics provides total control, more customized options, interactive reports and security. The dashboards and widgets provide a plethora of analytical capability. With the addition of LWC components in CRMA dashboards, developers get more flexibility to tackle more complex business logic using Apex and JavaScript to visualize the data. Embedded charts are also responsive, adjusting their size depending on the device. These tools cut development time and provide a seamless experience for website traffic.
Learn more about our CRM Analytics capabilities and reach out if you have any questions.
