
What is a recipe?
A dataset recipe is simply a saved set of transformations, or steps, that you want to perform on a specific source dataset or connected data. You would use a recipe to perform transformations like combining data from multiple datasets or connected objects, bucketing the data, adding formula fields, and cleansing the data by changing field values. You can remove fields and filter rows that you don’t need.
When you run a recipe, it applies the transformations and outputs the results to a new target dataset. You can schedule a recipe to run on a recurring basis to keep your target dataset up to date. With the introduction of aggregation, Salesforce has made recipes more powerful.
Let’s look at a sample scenario and how you can address the problem using aggregation.
Scenario: Your client wants you to create a dashboard where you need to filter the account based on number of opportunities, sum of opportunity Amount, average of opportunity.
- In a recipe, click the aggregation button

- To change the granularity of the data, add groups
- To calculate aggregated metrics for each grouping, use the following aggregate functions on measure columns: sum, unique, avg, count, max, and min

For example, to analyze key metrics for your accounts, group opportunities by account type, and then calculate the key metrics for each account: total amounts, max amount and min amount. The dataset (generated from the recipe) can be created with any dataset not specific to the dataset generated from the Salesforce object.
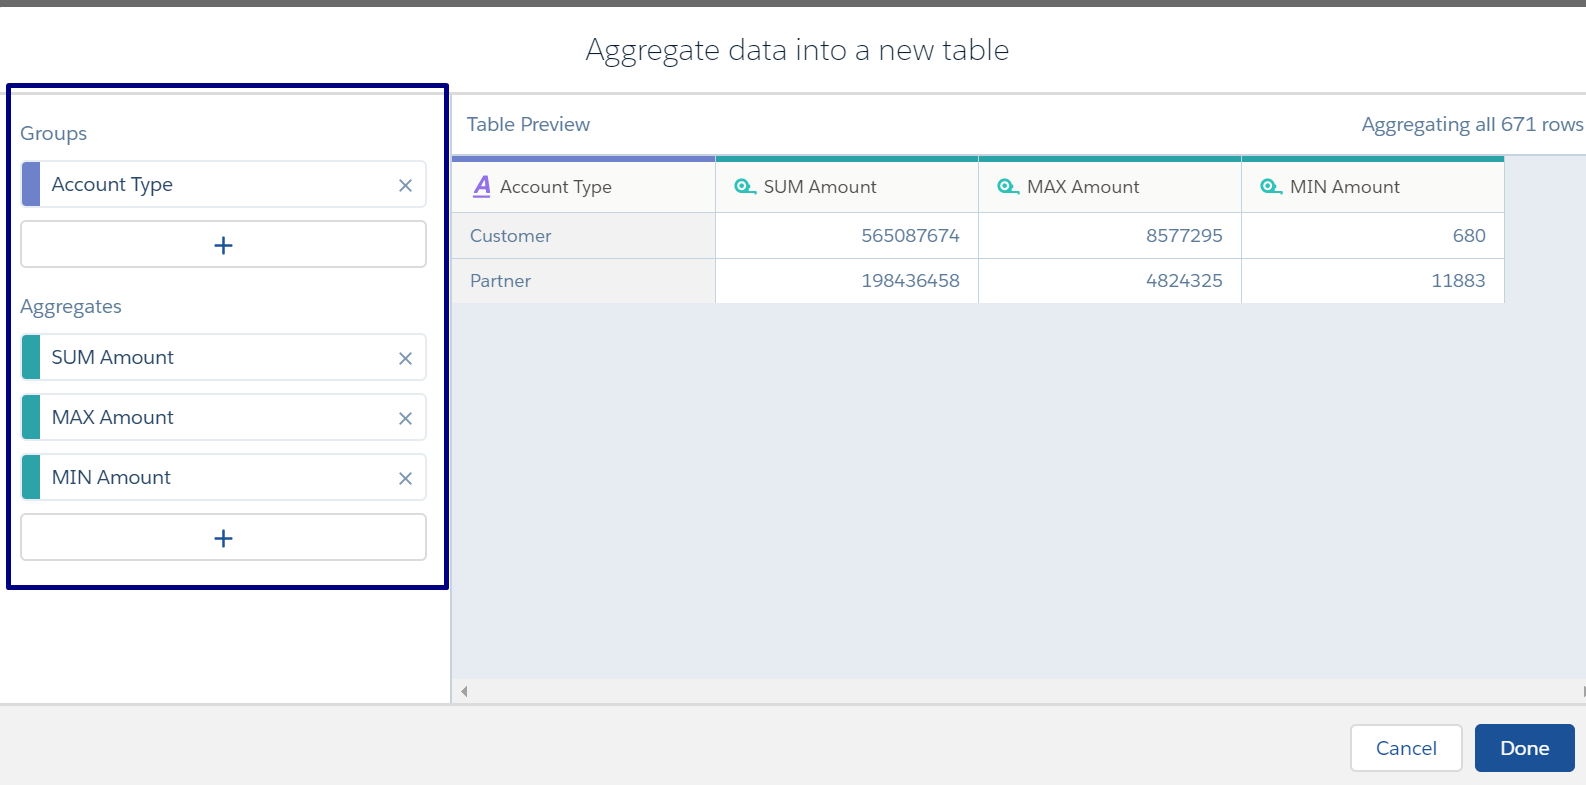
When you run the recipe, Analytics creates a new dataset that contains the aggregates that you specified and a grain determined by the groups. Check out the aggregates for each account type.

This summary dataset can be further augmented with the parent dataset. This is a powerful solution for many of the problems that we face in developing the analytic application.
How to Combine Related Data with Joins
There are different types of adding data, from Lookup to Left Join, Right Join, Inner Join, and Full Outer Join. Let’s look at each one and what they offer.
First, click on the add data button.

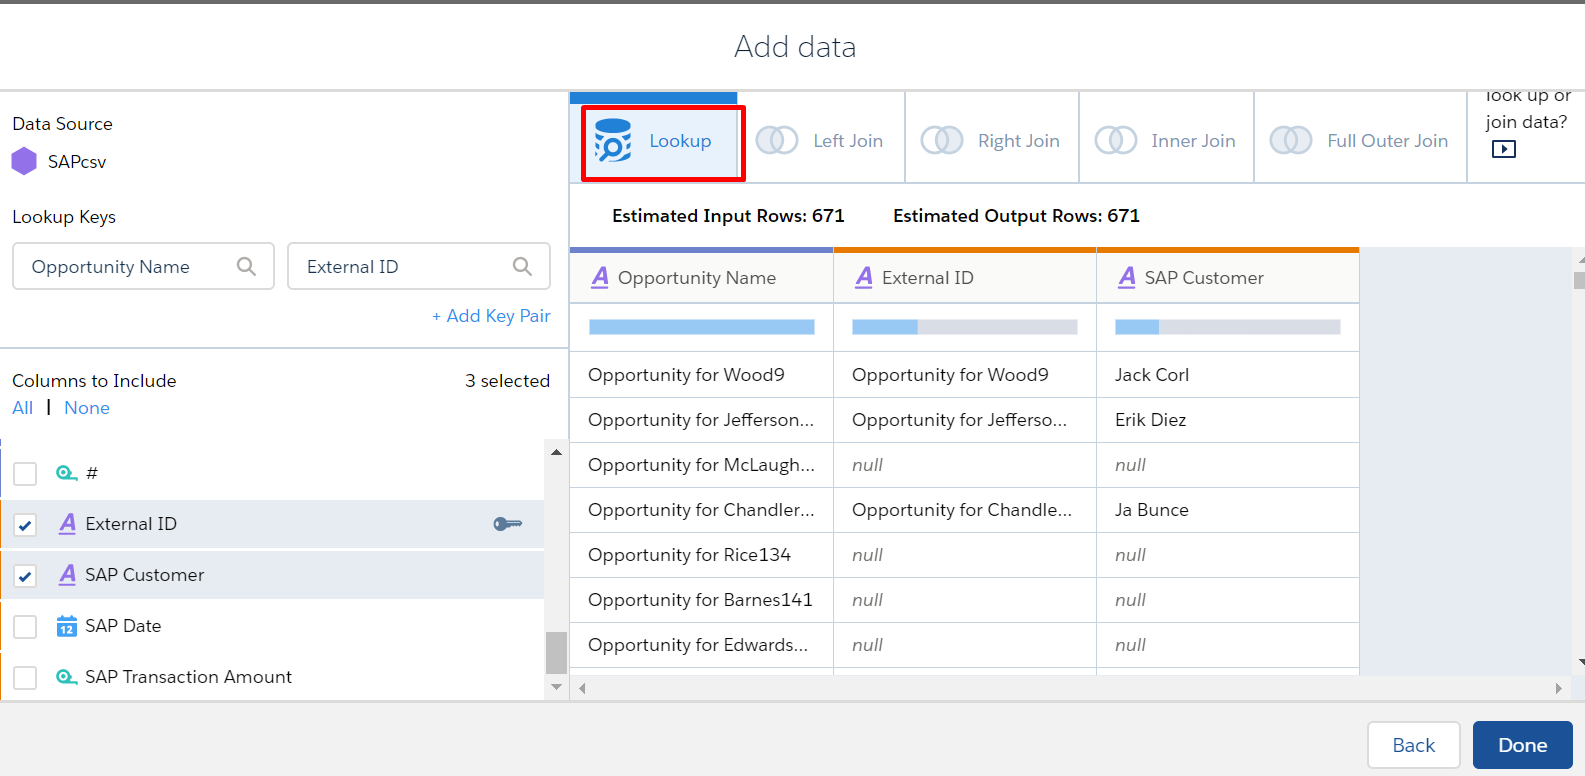
Lookup
This is the simplest relation of adding the data, all rows from the left and only matching rows from the right.
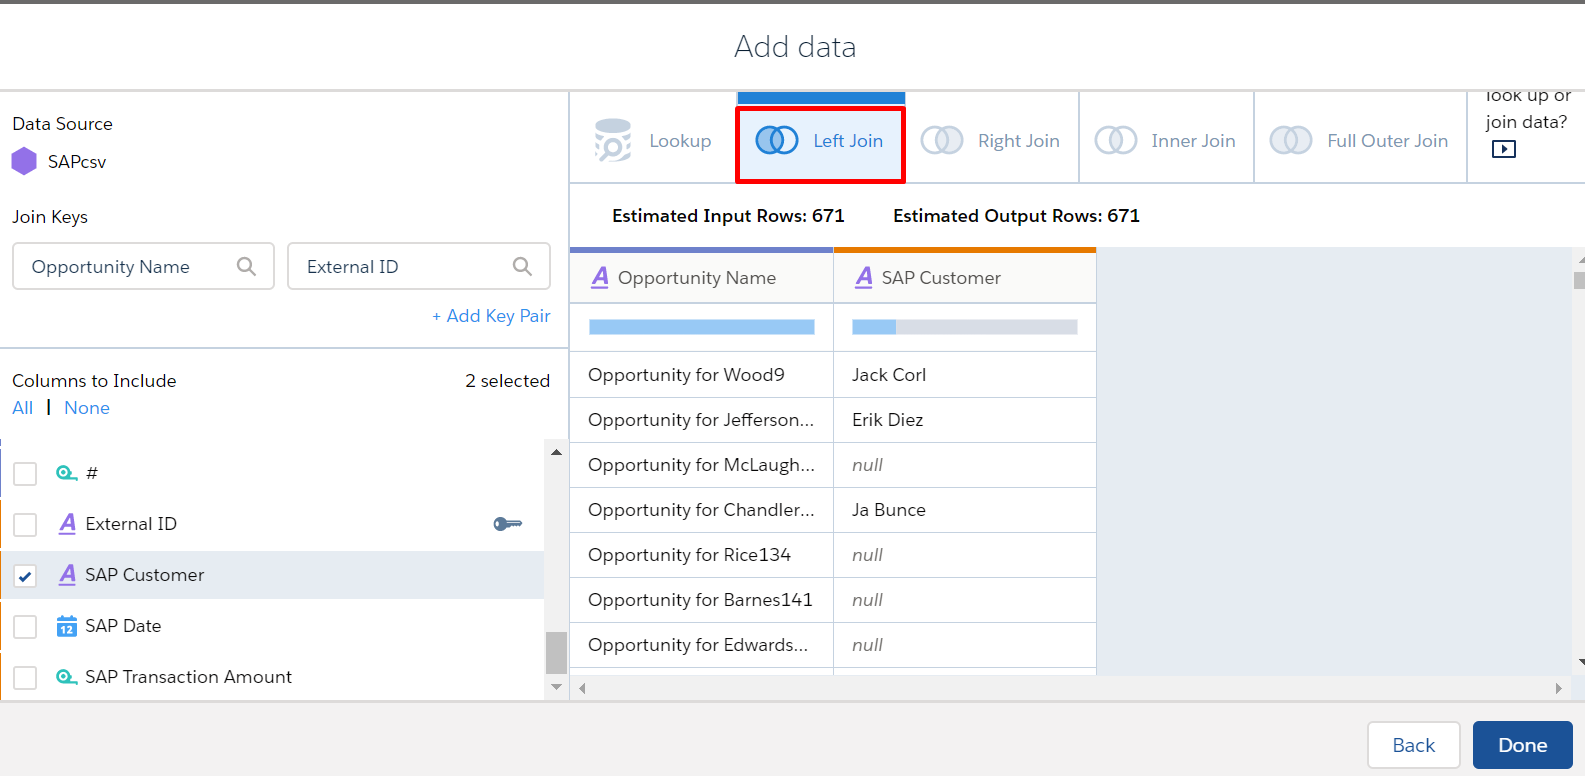
Left Join
Like a lookup, a left join includes all rows from the left and only matching rows from the right. Unlike a lookup, a left join includes all matched rows in the target when multiple rows match.
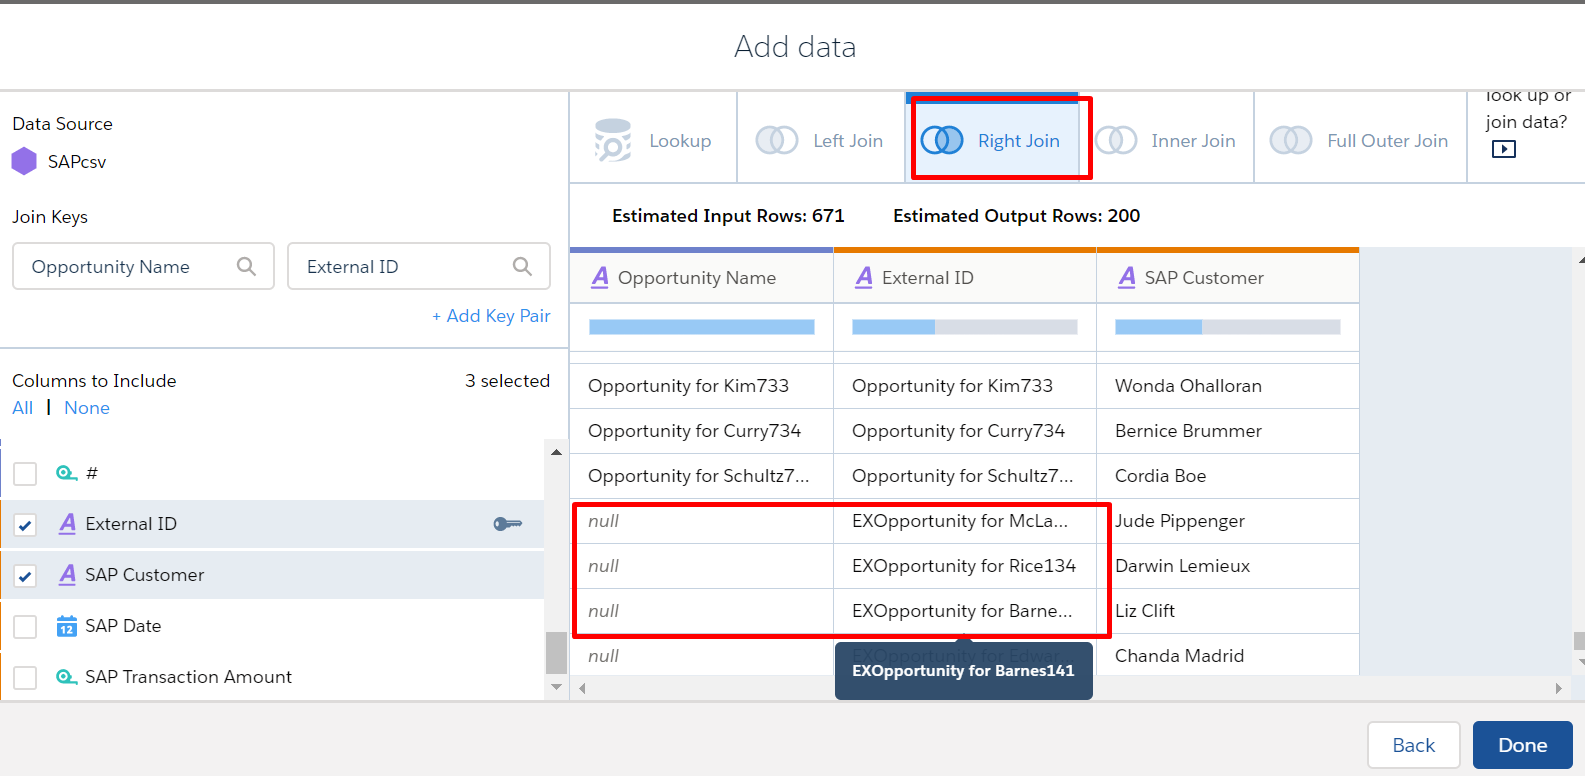
Right Join
A right join includes all rows from the right and only matching rows from the left. The right join includes all matched rows in the target when multiple rows match.
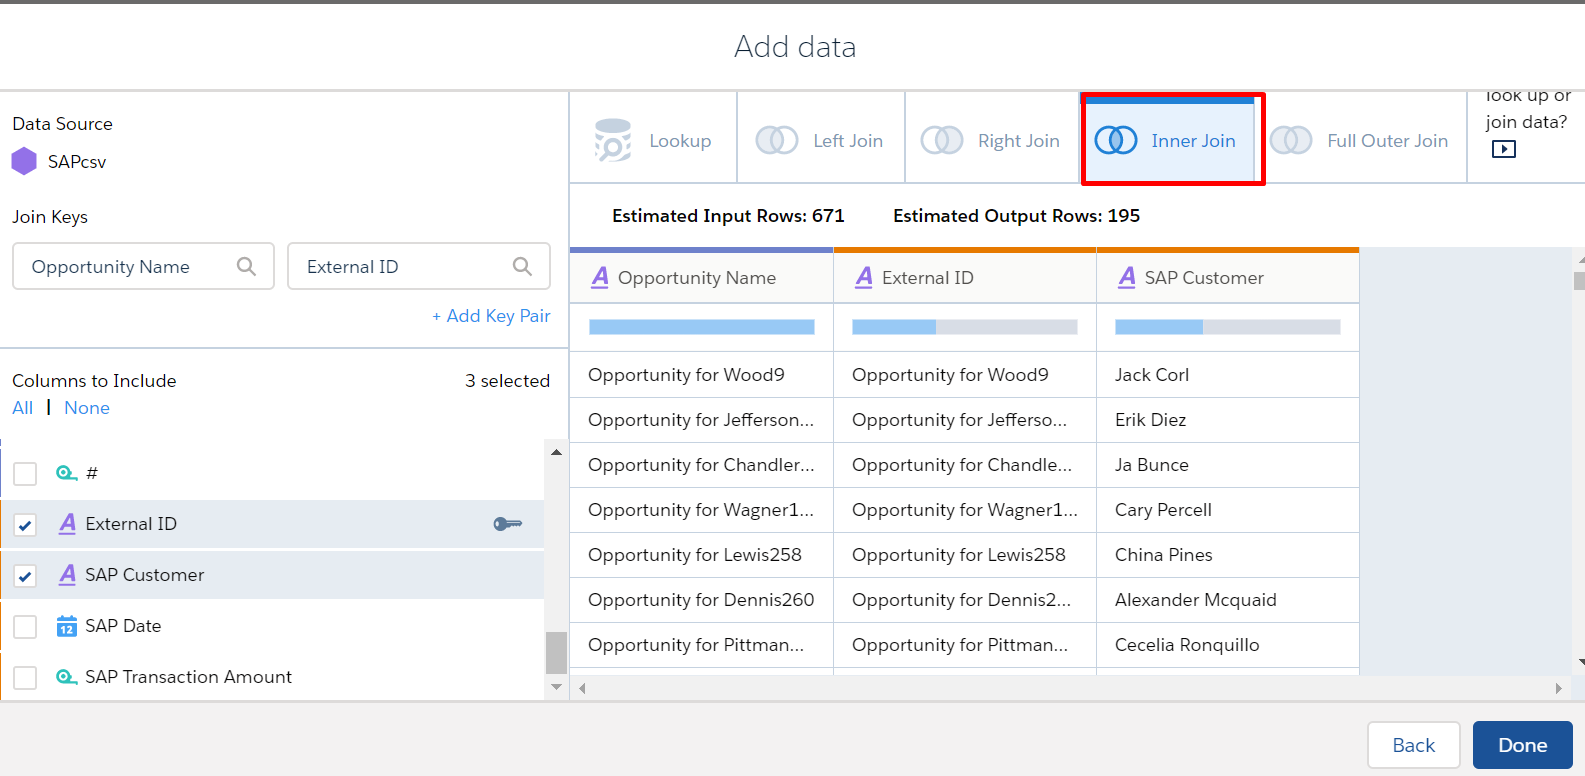
Inner Join
An inner join includes only matching rows from the left and right. The inner join includes all matched rows in the target when multiple rows match.
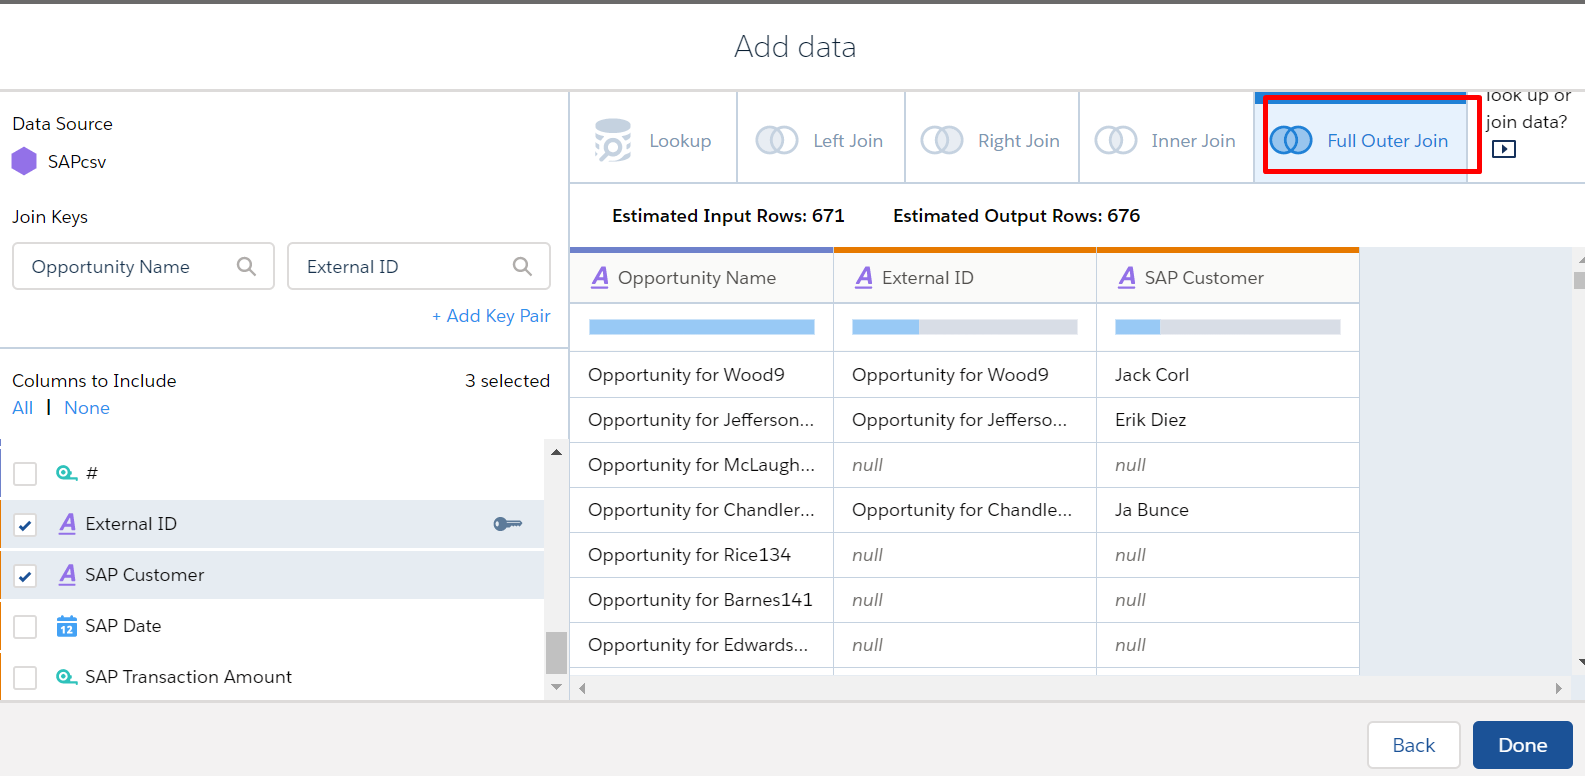
Full Outer Join
A full outer join includes all rows from the left and right, regardless of whether they have matches. The full outer join includes all matched rows in the target when multiple rows match.
Consideration: If the keys have duplicate values, the target dataset can become significantly larger than the input data streams. For instance, if 10,000 records on the left and 5,000 on the right share the same key value, the join creates 50 million (10,000*5,000) records in the target dataset. To return one record for each matched key value, use a lookup instead of a join. If you must use a join, add more key fields to ensure more unique key values.