


Express With Tableau: Useful Built-in Features to Know
We are all well aware that it is difficult to extract information by looking at thousands of rows on a spreadsheets, but data visualization makes it very easy to identify patterns and trends. It helps give us a clear idea of what the information means by providing a visual summary through maps or graphs.
Tableau has truly proved that when it comes to data analysis, it is more about asking questions, not about learning software. Tableau is providing limitless data exploration without interrupting your flow of analysis with its built-in features. That’s why people love using Tableau. Tableau is one of the most effective tools to create interactive data visualization. We can perform complex tasks with simple drag-and-drop functionalities.
In this article, we explore some of the many ways in which we can express with Tableau.
Wildcard Union and Cross Database Joins
To use cross-database joins, we first need to set up a multi-connection data source. To do this we can create a new connection to each database before we join tables. Upon connecting to multiple databases, a multi-connection data source is made from the data source. This can be beneficial when data is analyzed for an organization that is using different internal systems or when there is a need to work with data that is managed separately by both internal and external groups.
After the table is combined using a cross-database join, tables and columns in the data grid are colored in the canvas so that we can see which connection the data comes from. In some cases we may need to combine our data using data blending.
We can use the wildcard character (*) to match a sequence or pattern of characters in the Google Sheets workbook and worksheet names, and Excel workbook and worksheet. Instead of being limited to a single data source, we can now join cross-departmental data and work across multiple Excel workbooks as well. In Tableau, the data analyzed by us is generally made up of collections of tables that are related by specific fields. Joining combines that data on the basis of those common fields.
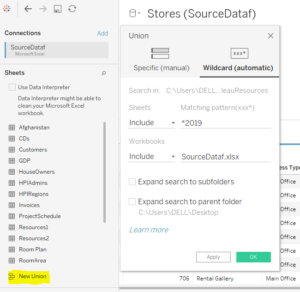
Suppose we enter *2019 in the Include Text box to unite tables in Excel worksheets with names that end in “2019.” Search criteria will give the result in the union of April2019, May2019, and Nov2019 tables (Excel worksheets), from the selected connection.
Watch the Tableau 10 feature video.
Cross Data Source Filtering
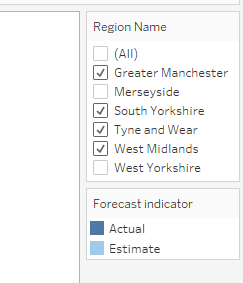
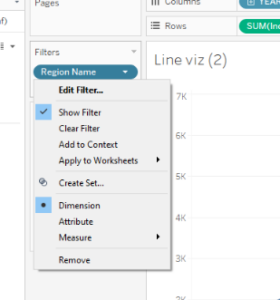
Are you tired of being able to filter only a single data source at a time? For data with common dimensions, Tableau now lets us filter across multiple data sources at the same time, and perform modifications to all worksheets with data sources using the same filter. Apply the filter to “All using related data sources,” and it will help in adding the filter to any worksheet whose primary data source has a relationship with the filter field. For all the related sources, the action will create a new filter that will populate the domain from the data source of that filter.
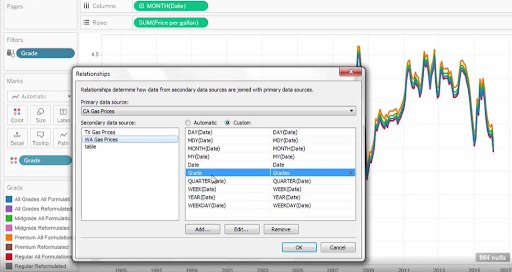
After we have identified the common fields, we can create relationships between them or map one field to another. The Edit Relationships option is not new to Tableau but we leverage it to provide great defaults and configurability. By default, any field in Tableau with the same name is treated as related. If we have common fields in different data sources with different names, then we can define a custom relationship (mapping the field names together), or we can simply rename the fields so that they match.
Watch the Tableau 10 feature video.
Data Highlighter
This is very useful when there are large amounts of data. This can enable us to search for data points in a view using keywords or select from a drop-down list. It can also highlight the specific data point while keeping the context of the other data points. Additionally, we can use it for ad hoc comparisons to help spot insights. This can be used across dashboards, actions, worksheets, and filters. So, this can highlight on color, size, or shape. It lets us quickly search and visually locate desirable data and without changing the context of the data.
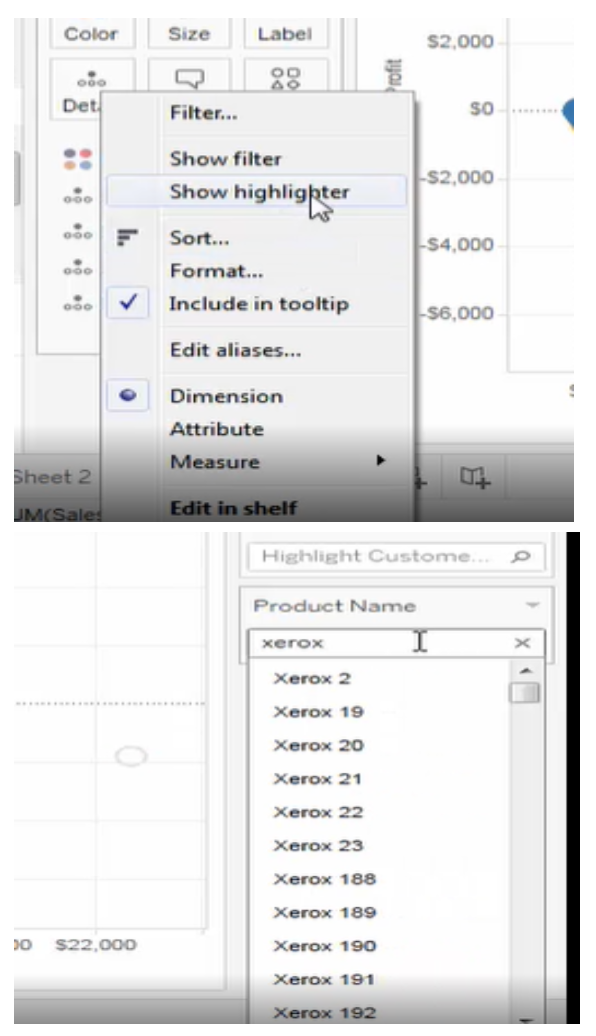
Interestingly, our selection is always saved with the workbook and when publishing it can be included in dashboards and stories.
Watch the Tableau 10 feature video.
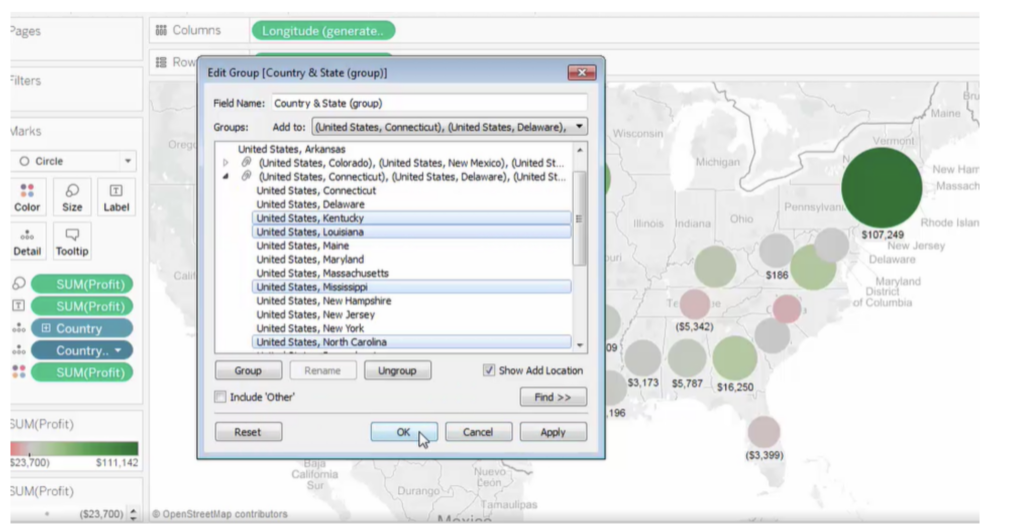
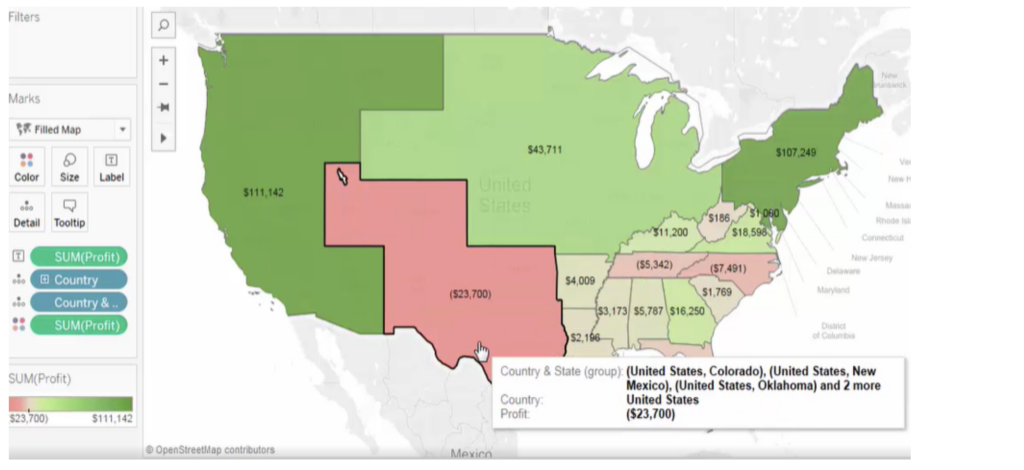
Custom Territories
To analyze the data on a map view we may need to group existing locations together to create our own territories or regions, such as sales territories for our organization while analyzing our data.
To make this simpler, Tableau has created a tool with which we can easily aggregate geographies to build our own custom territories. Now there are several ways to create territories such as select and group locations on a map, create a territory from a geographic field, and geocode a territory field using another geographic field. If our data source doesn’t contain a territory field at all, we can blend a territory field with another geographic field in our data source.
Watch the Tableau 10 feature video.
Workbook Formatting
Tableau is a top choice when it comes to simplicity and beauty of the design. Now, worksheet-level changes can be done at the workbook level by quickly changing fonts, titles, and lines by specifying format settings. It provides the workbook formatting feature that allows the user to easily apply their own personal style across an entire workbook with some clicks.
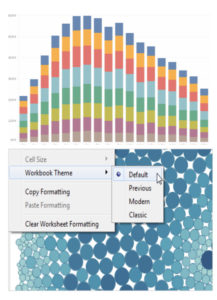
We may also want to remove grid lines from our view or make them more noticeable by increasing their pixel size or color. We can also change the workbook theme. New fonts are introduced which are legible even in small sizes. We can specify the style, size, font, and color for either the header text or/and pane text or both.
Watch the Tableau 10 feature video.
Learn more about Tableau and Tableau CRM and how the two reporting tools work together.
