


How to Test Code Coverage in Salesforce (Useful Tips and Techniques)
Salesforce comes with many out-of-the-box features and functionalities that can be customized to meet a client’s requirements. Testing in Salesforce involves validating the configuration and customization on the basic Salesforce org. However, this testing is quite challenging when we need to test only our custom code rather than Salesforce as a whole.
First, it’s important to understand our prime objectives when testing:
- Check code functionality.
- Verify changes before deployment.
- Ensure the system meets the client’s requirements.
- Identify errors/bugs early.
- Create and check functional flows.
Tests can either be handled manually, where a QA team handles unit testing, integration testing, regression testing, and system testing, or automatically with tools such as Selenium, Assure Click, QTP, etc.
This process is similar to other web-based applications, where testers have a clear understanding of the changes made. Developers and testers use Sandbox environments, from which tested code is deployed to production.
Test Coverage
We often come across a situation while working on a project that requires us to pull off the test classes coverage to know the current status of our code.
Testing is an important part of the Software Development Life Cycle (SDLC). Before moving the code in production, Salesforce ensures that your code has a minimum of 75% code coverage. This means that you have tested your code and it would not break in the production environment.
There are different ways through which we can test the code coverage of our classes:
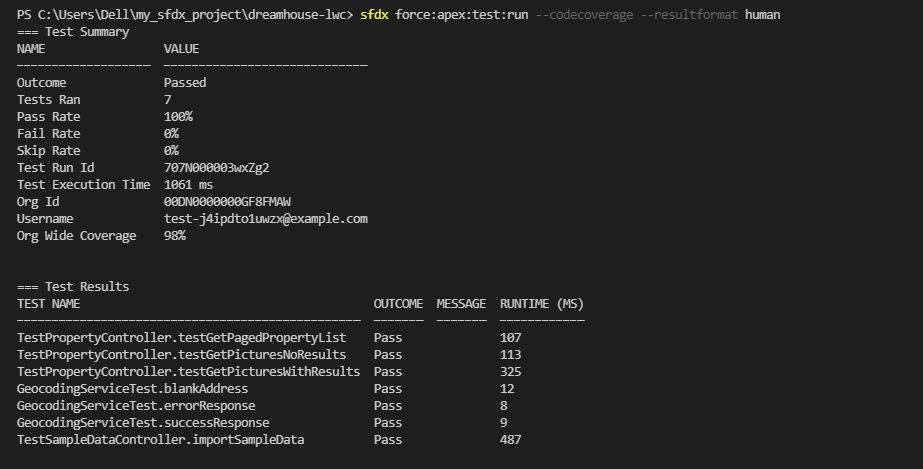
1. We can use the Salesforce CLI to retrieve the Apex Code coverage by simply running the following command:
sfdx force:apex:test:run –codecoverage –resultformat human
2. Using Developer Console
Follow the steps below to retrieve the aggregate code coverage details:
a. Setup -> Apex Test Execution -> Click on Option -> Uncheck the “Store Only Aggregated Code Coverage”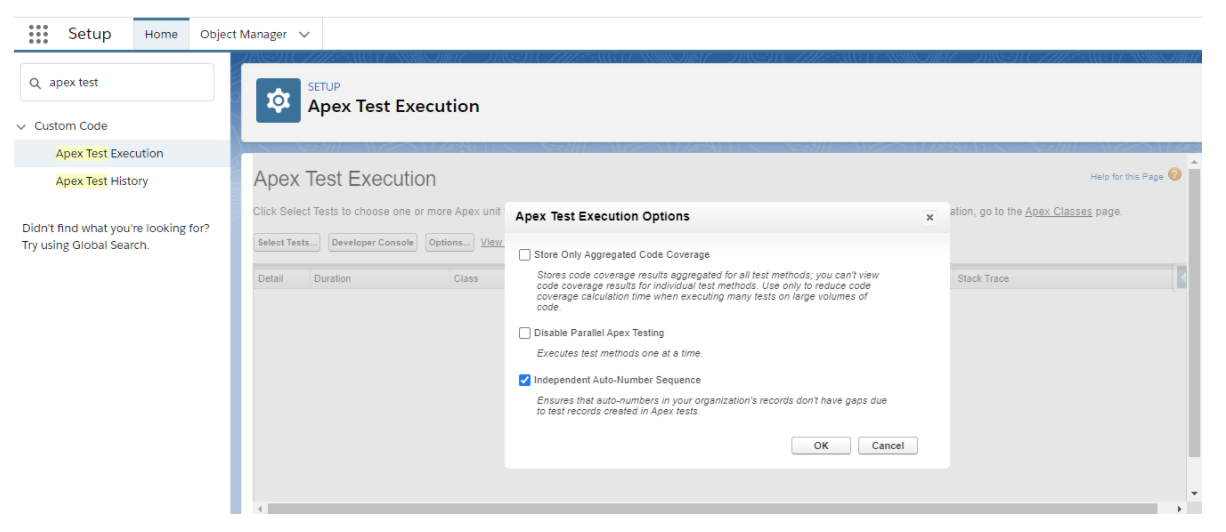 b. Setup->Apex Test Execution->Click “View Test History” and clear all test history.
Before moving on to the extraction, we need to compile all the classes first to eliminate the probabilities of error and then run all the tests. At this point we can identify which classes are failing and create a separate list for those.
c. Setup->Apex Classes-> Compile all classes.
Now that we have the compiled classes, we can see the overall code coverage for the org by navigating to:
Setup->ApexClasses-> Calculate Overall Code Coverage
If you’re still not confident with the result, you can follow the below steps that includes Tooling API.
3. Perform the above class compilation.
To know which classes have low coverage, there’s a simple process that can help.
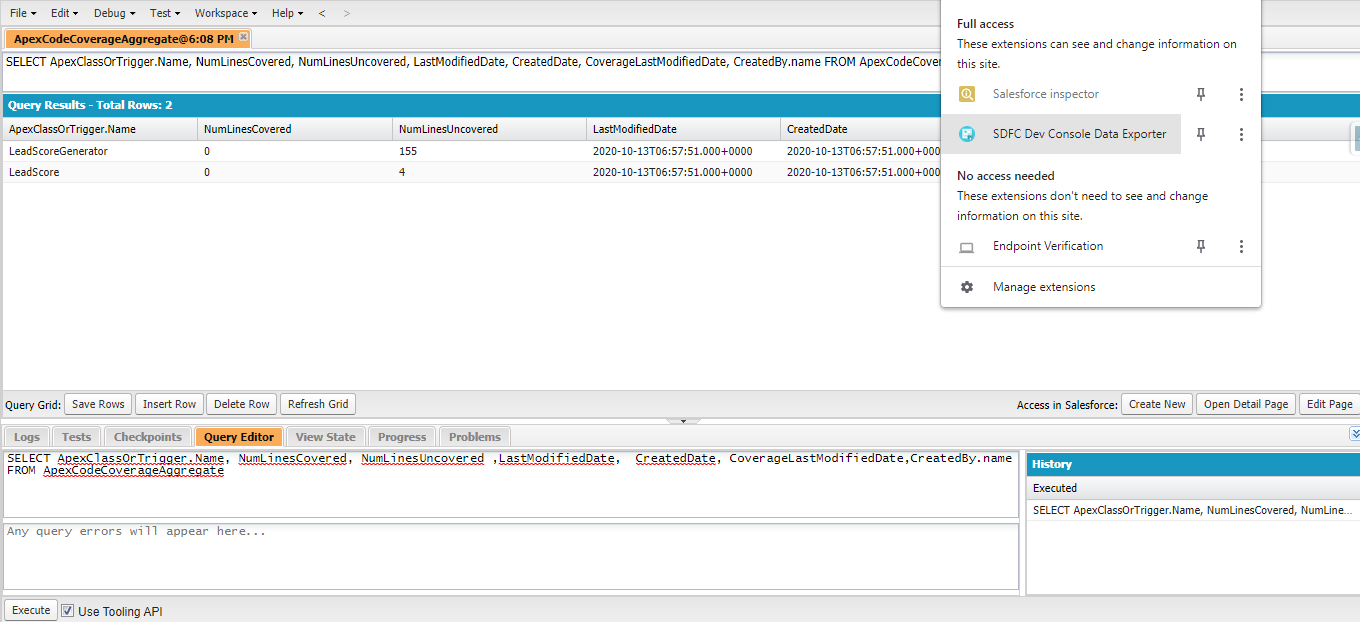
If you’re using Google Chrome, install the below extension:
SDFC Dev Console Data Exporter
Upon completion, we need to go to our developer console and write the query for the fields we need.
For example, we can use the following query:
SELECT ApexClassOrTrigger.Name, NumLinesCovered, NumLinesUncovered ,LastModifiedDate, CreatedDate, CoverageLastModifiedDate,CreatedBy.nameFROMApexCodeCoverageAggregate
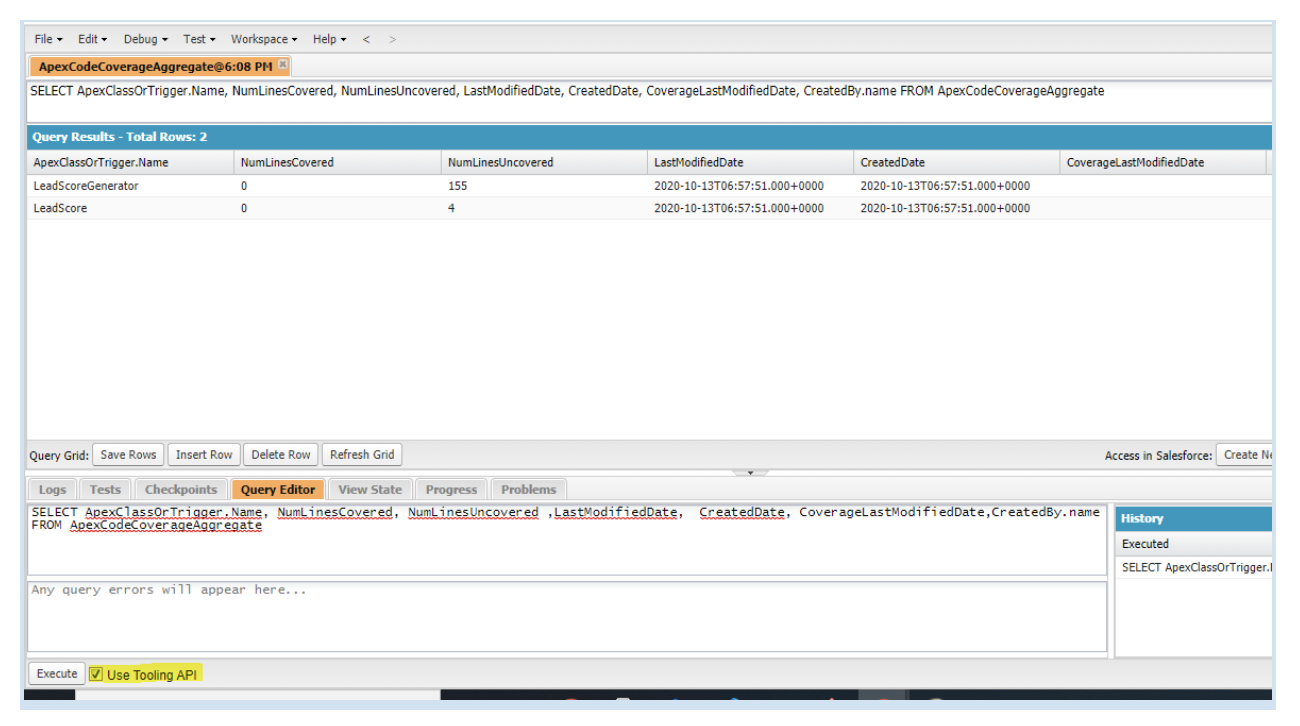
Here ApexCodeCoverageAggregate represents the code coverage test results for an Apex class or trigger.
It supports the following API calls : describeSObjects(), query(), retrieve()
The field it covers : ApexClassorTriggerId, NumLinesCovered,NumLinesUncovered,Coverage
Next we use the tooling API.
But how do we know when to use it?
Use Tooling API when you need fine-grained access to an org’s metadata. Tooling API’s SOQL capabilities for many metadata types allow you to retrieve smaller pieces of metadata. Smaller retrieves improve performance, which makes Tooling API a better fit for developing interactive applications.
We need to make sure we have checked the Use Tooling API checkbox on the Dev console.
After you execute the query, check for the extension on your browser’s top-right corner, select it, and it will pop up with the csv file for download.
Download the file and you’re ready to further analyze the high or low coverage using the simple formula :
=(NumLinesCovered/(NumLinesCovered+NumLinesUncovered))*100
This allows us to see the percentage code coverage and which class to work upon before we go to the production environment. Usually when we work on big projects, there are many orgs that come into play such as the development org, test org, etc. The deployment on higher orgs is done by a specific person or an individual (release Manager). It is better to assign the low coverage test classes to the same person who created them for reworking.
We can determine the actual creator of the class by following 2 simple steps:
- Extract the creator name from Dev against the different classes. You can run the same query from ApexCodeCoverageAggregate over the Dev Org and extract the Excel file.
- Do a Vlookup over the higher Org Excel data and the Dev Org data to extract the names of the creators.
A VLOOKUP function exists of 4 components:
- The value you want to look up.
- The range in which you want to find the value.
- The number of the column within your defined range.
- 0 or FALSE for an exact match against the value you are looking for; 1 or TRUE for an approximate match.
Syntax: VLOOKUP([value], [range], [column number], [false or true])
Recommended process for matching code coverage numbers for production
Now that we understand why test coverage is important and how we can gather the data for it, let’s go through the recommended process for matching code coverage numbers for production:
- We could use the full sandbox that is similar to the staging sandbox environment we use for production deployments. A Full Sandbox mimics the metadata and data in production and helps reduce differences in code coverage numbers between the two environments.
- We can use test data to reduce dependencies on data in sandbox environments and production organizations.
- We should write more overall test cases to increase the code coverage if deployment fails to production. The aim should be to raise coverage to 100%, then retry the deployment.
- If deployment still fails, we should run local tests from our production organization. We should identify the test cases with less than 75% coverage and then write additional tests for those classes to raise the code coverage.
Code coverage general tips:
- Always have a fresh pull of the code coverage, sometimes the code coverage numbers aren’t refreshed when updates are made to the Apex code in the organisation unless tests are run.
- If the organization was updated since the last test run, rerun the Apex tests to get the correct estimate of the code coverage.
- We should know that the overall test coverage of the organization doesn’t include the managed package tests. The exception may arise when the managed package tests cause your trigger to fire. The code coverage computed in a deployment after running all tests through the RunAllTestsInOrg test level includes coverage of managed package code. If you are running managed package tests in a deployment through the RunAllTestsInOrg test level, we recommend that you run this deployment in a sandbox first or perform a validation deployment to verify code coverage.
- We know code coverage is dependent on the total number of lines of code, so if there’s any insertion or deletion of code, it would affect the code percentage. For example, let’s say an organization has 50 lines of code covered by test methods. If you add a trigger that has 50 lines of code not covered by tests, the code coverage percentage drops from 100% to 50%. The trigger increases the total code lines in the organization from 50 to 100, of which only 50 are covered by tests.
Learn more about Atrium’s Salesforce consulting services.