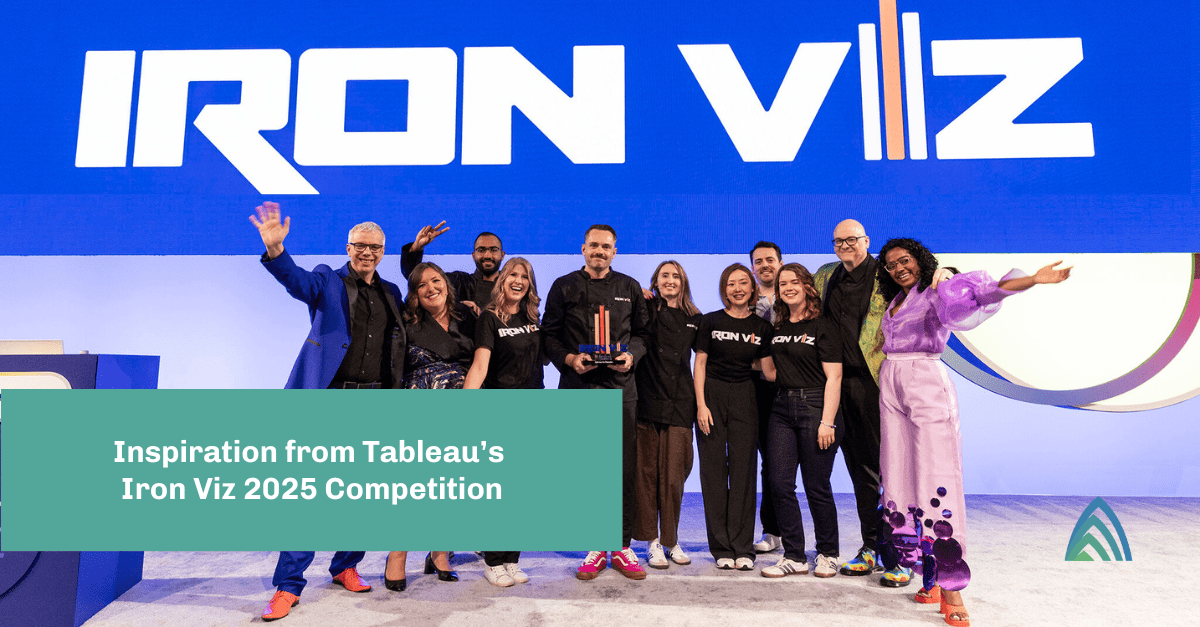
Iron Viz is the world’s largest data visualization competition. Three finalists compete live in front of thousands to build a visualization in Tableau in just twenty minutes from the same data. (You can watch past competitions here.) Like the qualifier leading up to it, contestants’ vizzes are scored based on analysis, storytelling, and design. The theme for this year’s qualifier was “art,” for which entrants had 28 days to think of a story and design, harvest the data, and build the viz!
This year, there were nearly 200 entries. Read on to get the details on—and visualize—entries from my Atrium teammates and me!
Ilija Stojić: Vis à Viz
I found myself drawn to architecture and photography. A pattern emerged, making it tricky to determine whether I was talking about traditional arts or data storytelling. Architecture lent itself to business analytics with themes like “form follows function” and the need to consider how a person would use an element. Photography had me going for pages, which I tried to summarize Norman Rockwall’s Triple Self Portrait and the title, Vis à Viz.
Data visualizations can be like unaltered photos, seeming like an objective visual account of reality. However, both the person composing the image and the audience perceiving it do so with their own biases and experiences. How we frame a question or intent, the context it appears in, and convey imperfections can all have a part in a data visualization’s conversation to avoid a data version of “Instagram vs. reality.”
I love Iron Viz and the qualifier(s) leading up to it because you get to see what amazing things a very passionate community is capable of, and I always learn something! It could be about a subject, a trick in Tableau, or a different way of conversing with information, but one thing I’ve never had afterward was the feeling that it was time wasted. And just like the observation, “Photography has nothing to do with cameras.”, I hope individuals will not let lack of familiarity with a tool deter them from participating.
Check out Ilija’s Iron Viz 2022 entry.
Will Heikes: Revisiting Bro-Country
In 2012, country music was first exposed to a sub-genre that would come to dominate the music scene for years to come, bro-country. The genre consisted of songs that sang about dirt roads, moonlight, tailgates, trucks, and referring to women as “girls.” By 2014, the bro-country dominated the country music landscape, and persisted for years to come. In 2016, the persistence of bro-country led me to write the capstone paper for my economics degree at Clark University about the genre’s impact on the country radio charts. I studied whether using bro-country lyrics like the aforementioned “girl,” “dirt road,” among others, increased significantly during the bro-country period.
Five years after I wrote my original study, Iron Viz gave me the opportunity to revisit what I did in college to see if the story still held up. Was bro-country a lingering force in country music like it was in 2016, or a relic of the past? You’ll have to check out my dashboard to see, but I’ll give you a hint, bro-country isn’t completely gone!
All in all, Iron Viz allowed me to share something that I’m passionate about, and helped me expand my knowledge of Tableau. I got to try making things I had never imagined before, like sigmoidal area charts and nested tooltips, which I know will help me with my future Tableau work. I’m already thinking about the dashboard I’ll make for the next Iron Viz!
Check out Will’s Iron Viz 2022 entry.
Pavan Kumar: Virtual Gallery of Art
After March 2020, the worldwide lockdown was implemented and a lot of restrictions regarding social life stepped into our daily lives. One of them was that we were not able to move out to public places—or it’s highly restrictive. The art museum is one of the places which was shut down completely. So, I thought to design something which can act as a central repository for all the art-related documents (i.e., painting, photos, design). I got the data set from Kaggle and designed a dashboard that can detail (number analysis) about the art gallery and users can search the desired element (e.g., painting, photo, design) by selecting multiple options (filters).
As titled, this dashboard is acting as a virtual gallery of art and I intend to provide the feel of a real museum through the Tableau dashboard.
Check out Pavan’s Iron Viz 2022 entry.
Tyler Pollard: Country Music Over the Decades
My Viz, Country Music over the Decades, was a spur-of-the-moment decision so that I could stay a sharpshooter in Tableau. I found an online database by Dave Tompkins with a list of the Top 100 Country songs of all time. The goal of my entry was to examine certain aspects of the songs through the lens of decades. I went with a simplistic approach, having only three visualizations on my dashboard. One analyzed the count of Top 100 songs by decade versus the average ranking of those songs within the Top 100, another showed average beats per minute overtime, and the final showed the trend of song length by decade. I utilized a dark background with lighter colors so that my charts and text would jump off the screen and be easy to read.
I think Iron Viz is a valuable competition. In today’s data-driven world, Iron Viz offers you free practice in Tableau and forces you to think about the story behind your data. It accomplishes both of these while allowing you to flex your creative muscles and work within your passions. I would highly recommend it.
Check out Tyler’s Iron Viz 2022 entry.
Learn more about Atrium’s Tableau expertise and how we can help you get more value out of your data.


