

Use the Power of Tableau Prep to Automate Data Transformation
Manual data manipulation in Excel is common. However, collecting data from disparate sources and cleaning, filtering, sorting, pivoting, and doing calculations manually not only takes lots of time but also makes mistakes more likely.
Tableau Prep can not only complete all of the most common data manipulation steps but it also adds capabilities like Joins that are not readily available in Excel. Automating these activities through the capabilities of Tableau Prep can reduce process complexity and increase the visibility of errors in data and processes. The end result is a curated data source immediately available in Tableau Desktop or Web Edit for visualization building.
Let’s walk through using Tableau Prep in real-life scenarios
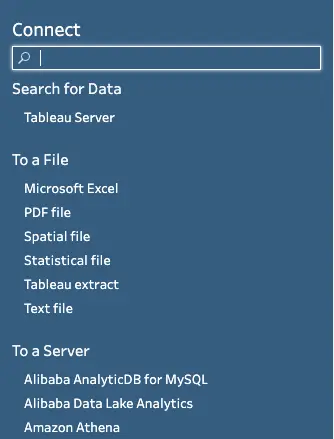
Starting from the top, Tableau Prep offers myriad options to connect to data. For those already using Tableau Server or Tableau Cloud, this means Tableau data sources can be directly connected and no longer need to be downloaded as crosstabs for disparate reporting. For those using many different sources of data to create datasets, all of these sources can be integrated into Tableau.
To list just a few, Tableau Prep can connect directly to Excel files, Google Drive, Snowflake, and Salesforce. Within these data connections, fields are selectable, so only the necessary data is brought into your Tableau Prep flow rather than having to manually delete columns within Excel.
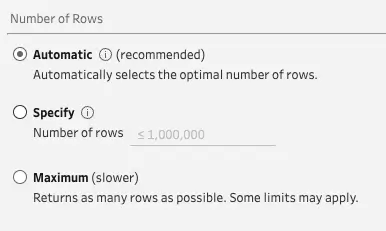
A sampling method can be chosen so that throughout development the right amount of data can be seen to balance efficiency and identification of anomalies in the data. Incremental refresh can be enabled so that each time the flow runs, only new data is pulled in, and Tableau Prep automatically assigns the data types to the fields.
Finally, within the input step, data types can be adjusted, and filters can be added to keep just the data that is needed (e.g., filtering the date to the last quarter or year to increase efficiency when the flow runs).
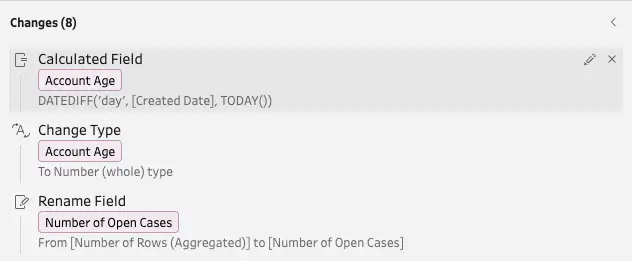
Next, clean steps are used to replace many of the manual steps taken in Excel. Fields can be filtered, removed, and renamed, and calculated fields can be created to replace any number of Excel calculations.

A good example of how Tableau Prep can replace multiple sheets in Excel with a single clean step is in creating a percentage of total calculation. Let’s say we want to calculate the percentage of the total amount per account that each opportunity represents. With Excel, a pivot table would be created using the account as a grouping field and the sum of amount as the aggregate, then a VLOOKUP would be created for the accounts in the opportunity table.
Finally, the opportunity amount would be divided by the total account amount in a new column to create a percentage of the total. In Tableau Prep, this simply looks like two calculated fields: a fixed level of detail equation to sum the amount by account and a division to calculate the percentage of the total. A solution like this one is easier to implement and more efficient when running in Tableau Prep than Excel. It also allows you to move LOD calculations out of Tableau Desktop to improve workbook performance!
Joins in Tableau Prep
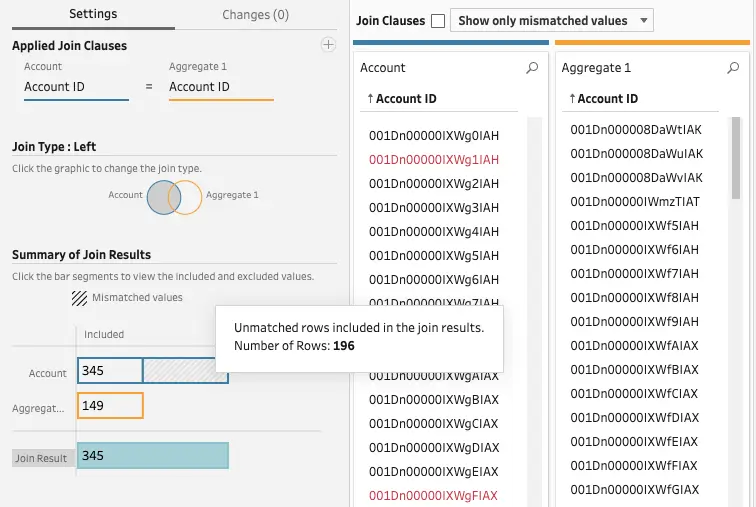
Finally, Joins in Tableau Prep offers a way to combine data together and discover mistakes that are not possible in Excel without complex power queries. Let’s say we have a table of product groups and their associated products, along with a table containing sales data for those products. We want to see how product groups are performing, so we need to join the product group data to the sales data. We could do this in Excel using a VLOOKUP, but throughout our data, we are seeing errors where products aren’t matching up. Is it a spelling error? Is our lookup table missing a product value? We’ll have to search through the errored fields to find the source of the issue.
What happens when there are multiple issues, or we want products to be associated with multiple groups? Or when product group associations change over time and now have a timestamp associated with them? In Excel, we can write a Join query to replace our VLOOKUP, but this is hugely complex for most Excel users. Either way, the process in Excel becomes complex quickly, making oversights and mistakes easier and easier.
Joining in Tableau Prep allows for easy selection of Join fields, gives the user a list of mismatched values in the tables, and makes it easy to change the values within these fields if spelling or punctuation is an issue. Tableau Prep also shows the number of rows in each connected table — and the resulting number of rows from the join — so the user knows if their join is functioning as they expect.
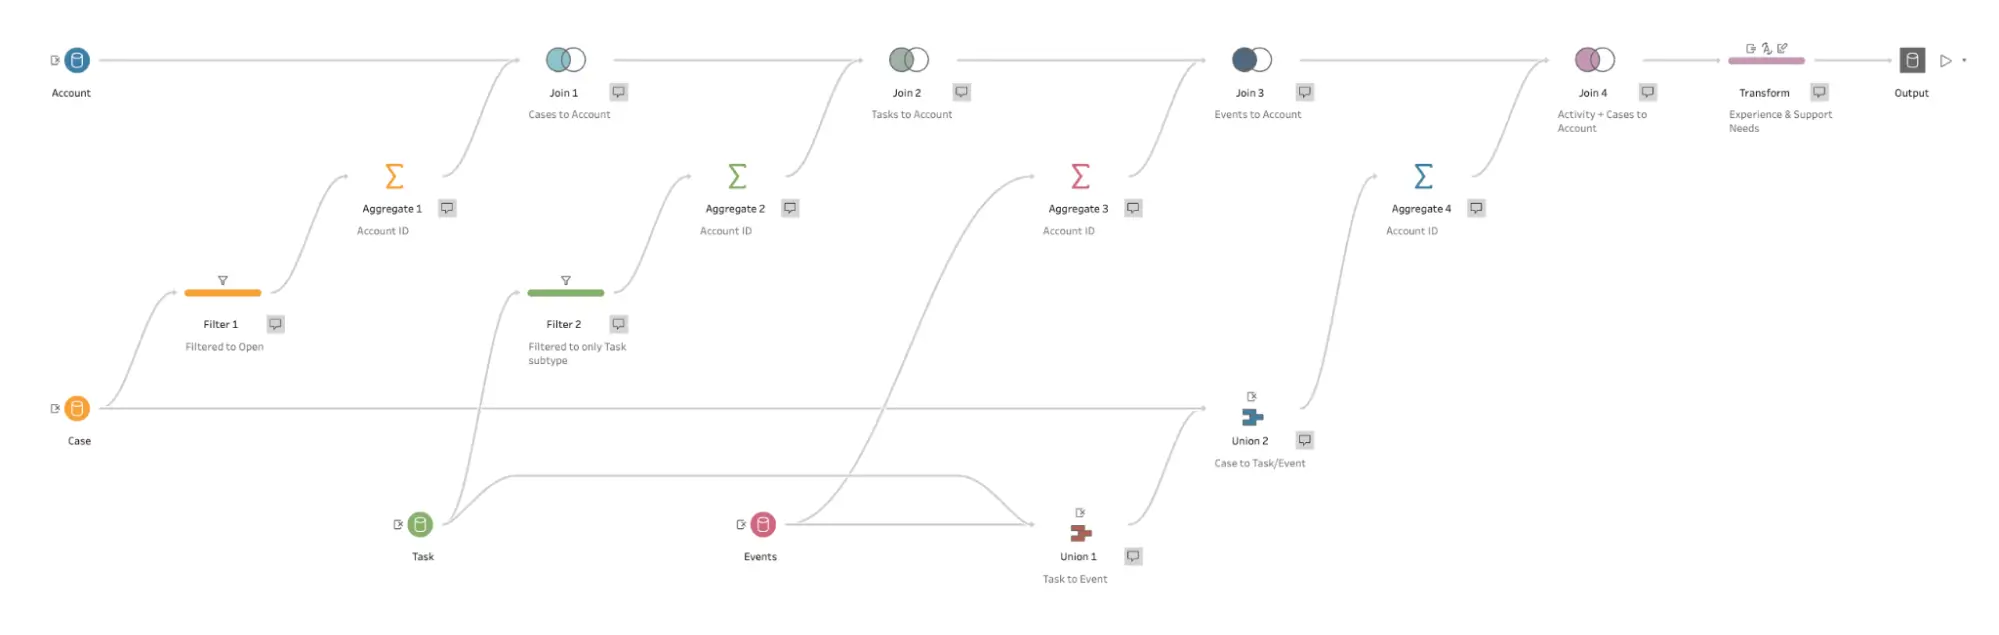
With all of our calculations finished and our data output looking the way we want it to, we can now trace through the Tableau Prep flow and label the different calculation nodes to their functions, as well as write notes under each node.
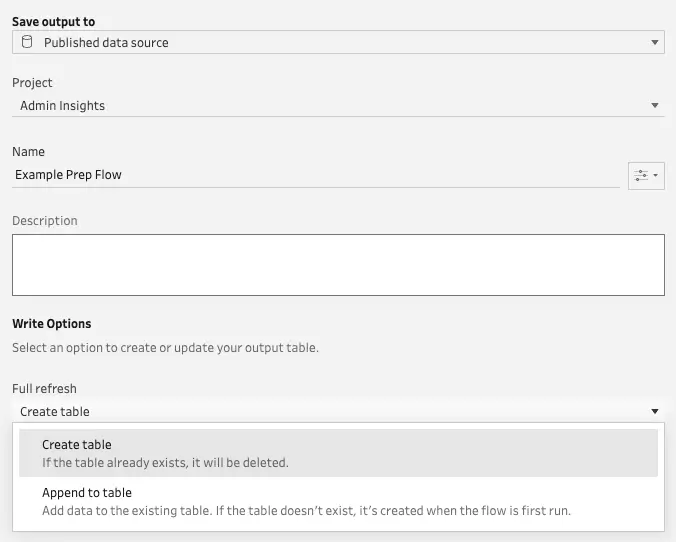
We can push run on the flow at any point and save it as a hyper, CSV, or Excel file, or publish directly to our Tableau instance as a data source. Now, if I win the lottery tomorrow, someone can look into the Prep Flow and quickly understand how to adjust and maintain the flow as needed without extensive written documentation and continue to run the flow into any dashboards being used by the output.
Get started with Tableau Prep today
These are just some of the tactical benefits of Tableau Prep that will allow you to connect to, transform, and prepare your data for the most efficient views to start building your analytics. Couple that with the Data Management add-on, and you can automate Tableau Prep Flow refreshes on your Tableau Server or Tableau Cloud to automatically run and refresh your Datasource outputs from Tableau Prep! You will not only save time wrangling data on the backend, but set yourself up for success to build Tableau Dashboards more quickly on datasets you trust.
Learn more about our Tableau consulting services and how we can help you accelerate your data journey in Tableau.
