
Tableau’s Iron Viz is more than just a competition, it’s also a way to learn and develop your Tableau skills. Every year, Tableau enthusiasts from around the globe submit their best attempts at Tableau dashboards to compete against the best of the best for a chance to win glory in the name of data visualizations. Win or lose, those who submit are sure to hone their skills in dashboard development, design, and critical thinking.
All dashboards tell a story
When we think of Iron Viz, we probably think of the flashy designs and creative ways to display data in dashboards. And yes, that is a big part of what makes Iron Viz amazing. However, the main purpose of Iron Viz is to tell a story with data. And that’s what we are supposed to do every single day as Tableau dashboard designers.
At its crux, Iron Viz is an exploration of data visually. We have a data set, and we need to find the best way to display it in order to tell the story we want to tell. It’s one person, one data set, and one dream.
Iron Viz forces us to think critically about the data source that we are creating. What is the first question we want this dashboard to answer, and how are we going to progress through our story using that data set?
And while this time you might be making a dashboard about your favorite video game or favorite TV show, the same principles apply in our day-to-day lives. When we are designing dashboards for customers or different groups, we need to think about how the viewer is going to use the dashboard. If they’re opening up a dashboard related to their sales metrics, what are the questions they’re going to want answered? Just like in Iron Viz, we are going to have to put ourselves in the shoes of the viewer to understand just how we can create the best visualization possible.
Data architecture (and critical thinking) are key
Just like in your day job as an analyst or data scientist, Iron Viz requires data. However, the data isn’t always going to look how you want it to to create the data sources you need. This might require us to transform, transpose, or manipulate the data to get it into the format that we need for our final visual. Utilizing tools within Tableau like Tableau Prep, and Relationships, or even partner tools like Snowflake, we can restructure our data to match exactly what we’re looking for.
For my submission this year, I needed data for the prices of virtual items a user can buy on the computer game Neopets for every month. The problem was that data didn’t always exist for every item, every single month. For this reason, I needed to use Tableau Prep to populate the months with missing data with the data from the preceding months. This allowed me to learn how to use some of the fill features in Tableau Prep that I had never used before.
Because I had to think critically about what visuals I wanted to create and the story I wanted to tell, I was able to dive deeper into my data to set up a data source to make my submission a success!
The best part? It’s all open source
Iron Viz is truly unique in that all the data, and visualizations are available for download to anyone and everyone! That means, if you see a visualization, data source, or creative way to display a dashboard, it’s all there and available to download! Below, I’ll run through a few ways the visuals created in Iron Viz can help you transform the dashboards you make in your day to day life.
Sankey Charts
One of the most popular visuals you’ll see across social media is the Sankey chart. The Sankey chart allows for you to see the progression of data over time, or into different categories. You’ll see the Sankey occasionally in Iron Viz. From this year’s Iron Viz, we had a visual showcasing American Idol contestants sales and award success after leaving the show.
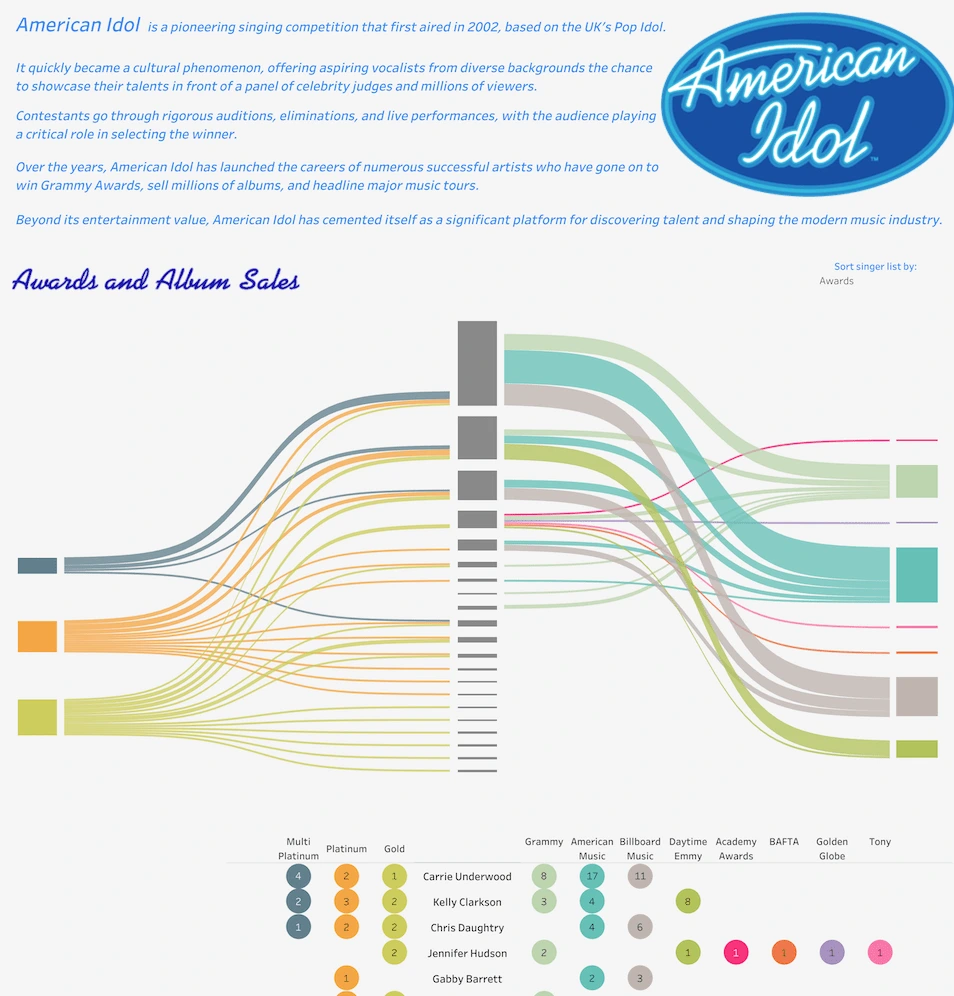
Screenshot: American Idol – Iron Viz 2025 Submission by Haim
We can download this visual, and reverse engineer it the next time we need to create a Sankey chart to show the progression of leads over time, or opportunities to completion.
Curved Timeline Chart
Timelines are an important part when you want to explain the steps that take place in a dataset over time. Take a look at this Box Office Bomb dashboard. Here, the author creatively used space to display a timeline both horizontally and vertically, rather than just a traditional timeline. We can utilize the principles of this visual in our future designs when creating documentation or outlining a sales process from beginning to end.
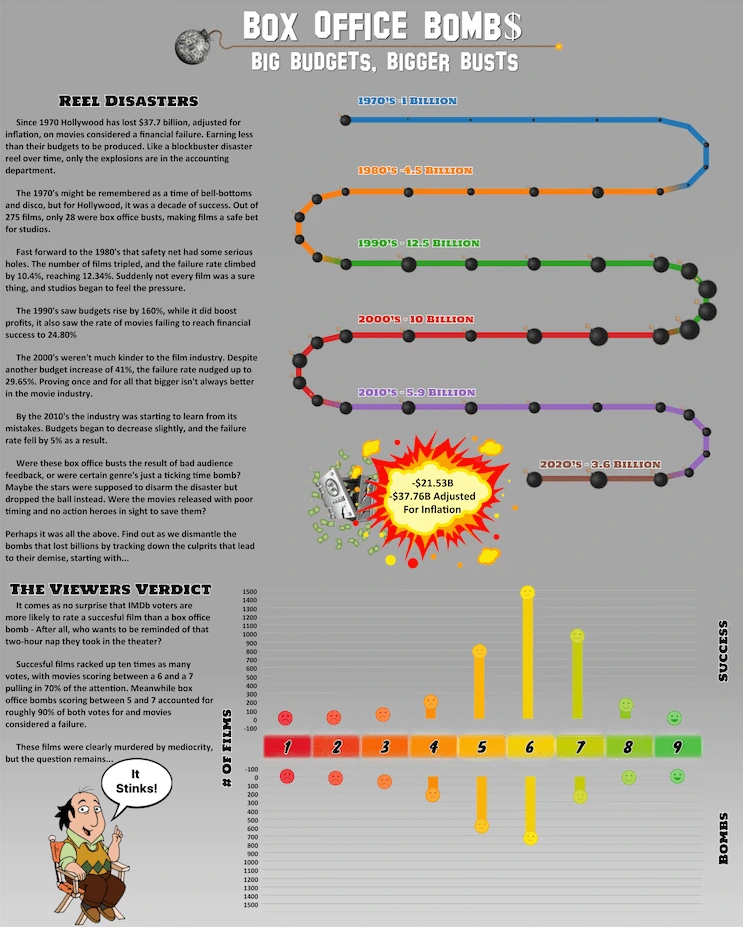
Screenshot: Box Office Bomb$ by Benjamin Blevins
The dashboard opens with a striking line chart that expands across the entire view. This line chart isn’t just a clever visual, but an actual, functioning line chart with data powering the visual. The use of a gradient above helps to pull the user into the dashboard in conjunction with the visual. Dashboards like this one show that charts can be more than just a way to showcase data, but rather a design element on your dashboard as well.
Line Charts
Visuals don’t always have to be complex in order to be impactful. Take this dashboard about Interest in Chess over time. The dashboard opens with a striking line chart that expands across the entire view. This line chart isn’t just a clever visual, but an actual, functioning line chart with data powering the visual. The use of a gradient above helps to pull the user into the dashboard in conjunction with the visual. Dashboards like this one show that charts can be more than just a way to showcase data, but rather a design element on your dashboard as well.
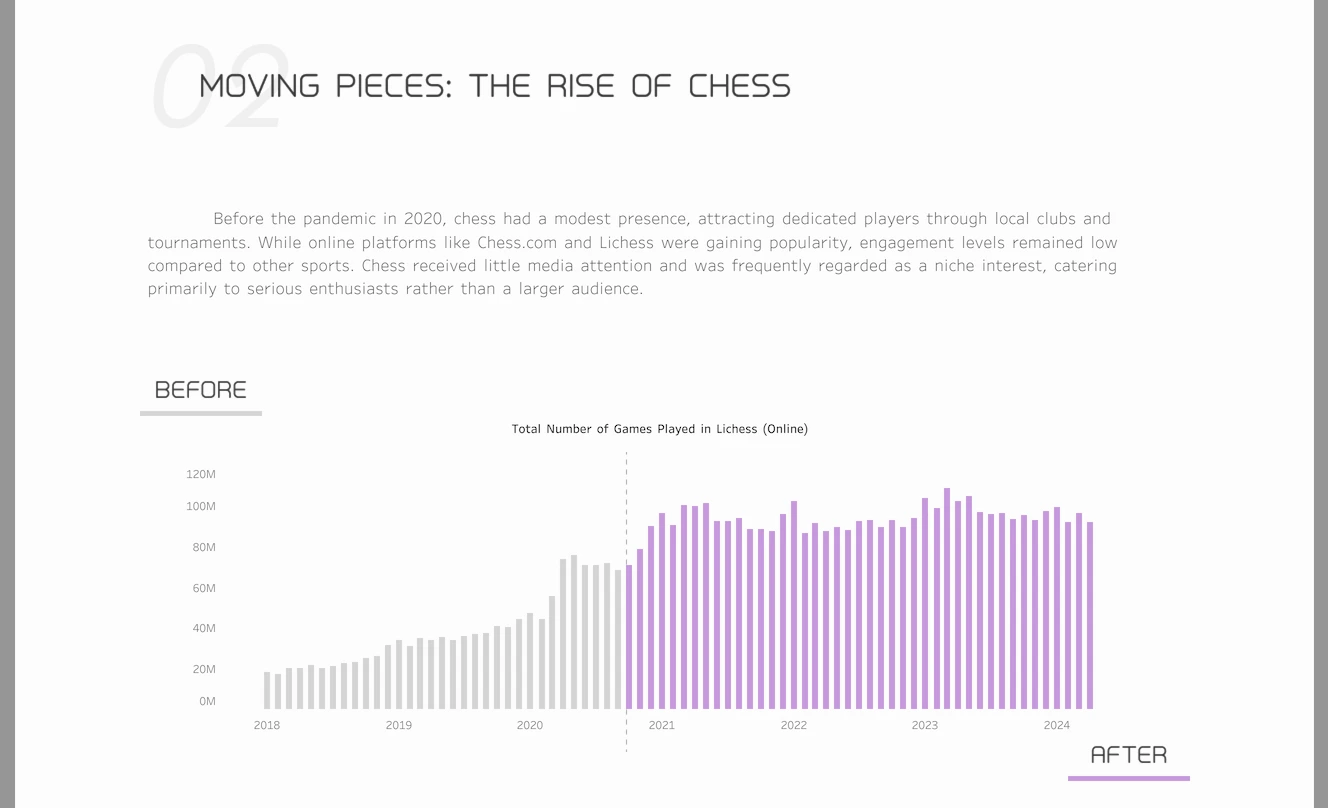
Screenshot: Chess in the Spotlight by Aakarsh R
Whether you’re a beginner or an experienced Tableau user, Iron Viz is an annual reminder that data visualizations can be more than a few charts on a page. By focusing on the data storytelling strategies used by the contestants, exploring complex visualizations, and reverse engineering visuals, you can level up your dashboards on projects, or for Iron Viz next year! The next time Iron Viz comes around, make sure to watch out and expand your Tableau horizons!
Need some more inspiration for your Tableau visualizations? Check out our gallery of pre-built analytics dashboards.


