Account Analysis

Compare a selected account with other accounts in the same industry across various criteria.
CRMA & Tableau: Better Together with CRMA Parameters

Use parameters in CRM Analytics to filter your Tableau dashboards/views.
Activity Planning: Who to Contact Next? (Tableau)
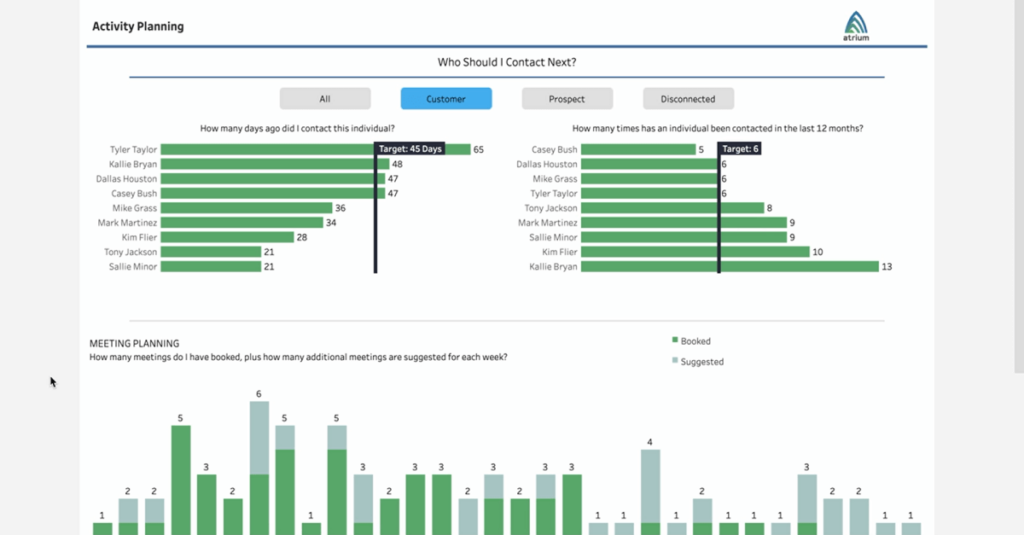
Set your activity plan by evaluating who in your portfolio should be contacted next.
Activity Tracking: Easily Identify Trends (Tableau)
View activites across a variety of dimensions and spot trends over time.
Metrics Leaderboard (Tableau)
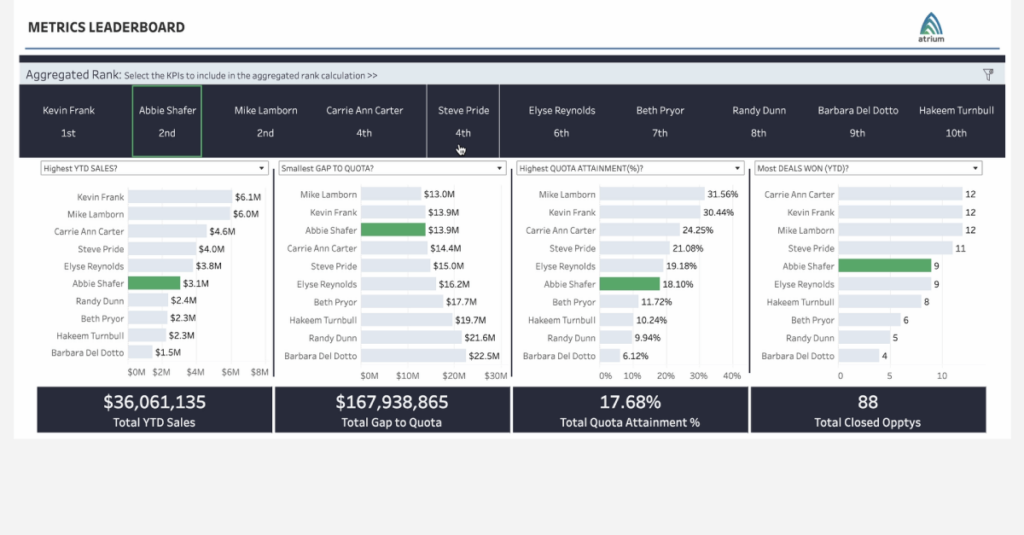
See how your team is tracking in aggregate and across nine different metrics.
Booked+Weighted Pipeline vs Quota (Tableau)
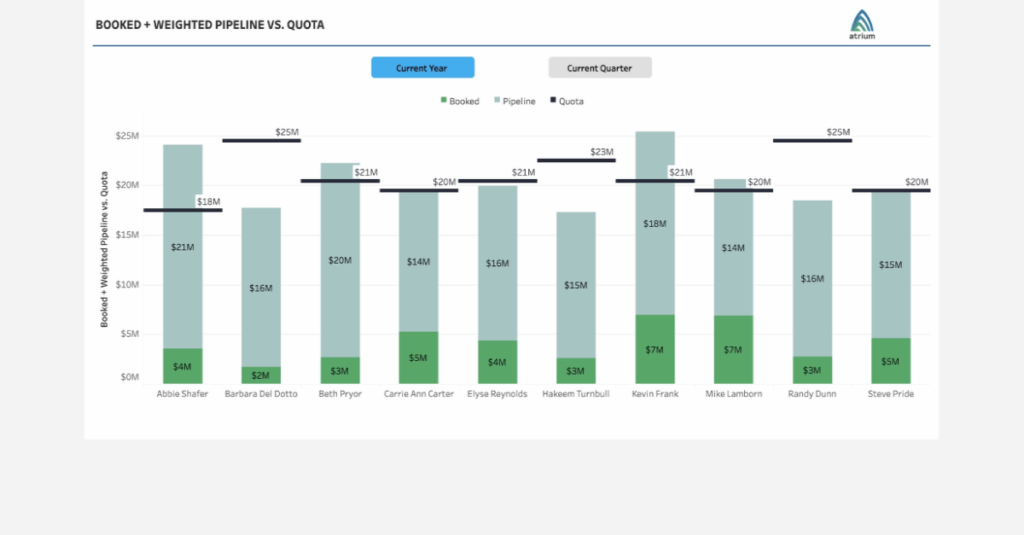
Show progress towards Quota Attanment via a stacked bar side-by-side with a solid bar.
Analyzing Pipeline Changes with Revenue Intelligence

With this Revenue Intelligence solution enhancement from Atrium, see monthly pipeline movement,
Banking Scorecard Dashboard
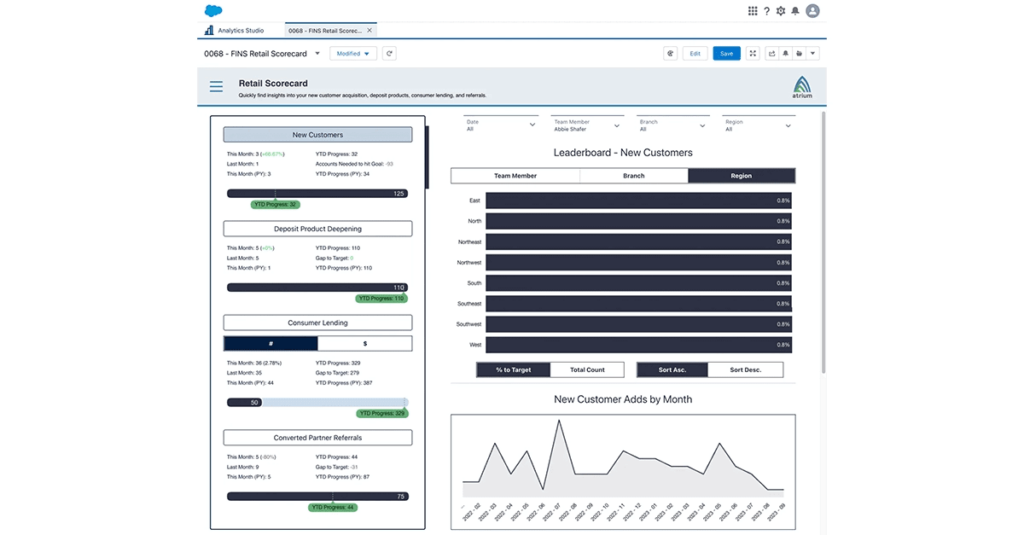
Insight into new customers, deposit product pipeline, consumer lending, and partner referrals.