


Ahead of the Curve: Data Analytics Maturity Model Guidance
After having a front row seat to hundreds of Atrium projects over the last five years that typically focused on the intersection of data, analytics, and CRM strategy, I started to see a trend emerging among our most successful customers. Those that understood the relative maturity of their data as well as the tooling they had in place to consume that data (e.g., targeted analytics, predictive models) — and kept (or brought) those maturity levels into alignment — saw the greatest returns on their investment.
In this post, I’ll examine the maturity curves for data and user experience tied to that data, so you can self-evaluate if your organization is in alignment. I’ll give you enough of a macro point of view that you can: A, place your organization on each maturity curve, and B, start to think about the right plan to move forward and harmonize your organization across the curves. (We at Atrium, of course, are happy to help with that.)
Data + experience: A full, healthy tree
When I talk about the full picture of what to consider, I like to use a tree metaphor. My data is the tree’s root system — everything under the surface that is generally hidden from view, but essential to the health of the tree. In order for my tree to grow larger, it must continue to expand its root system. The consumption of that data, or associated user experience, is everything we can see above the surface.
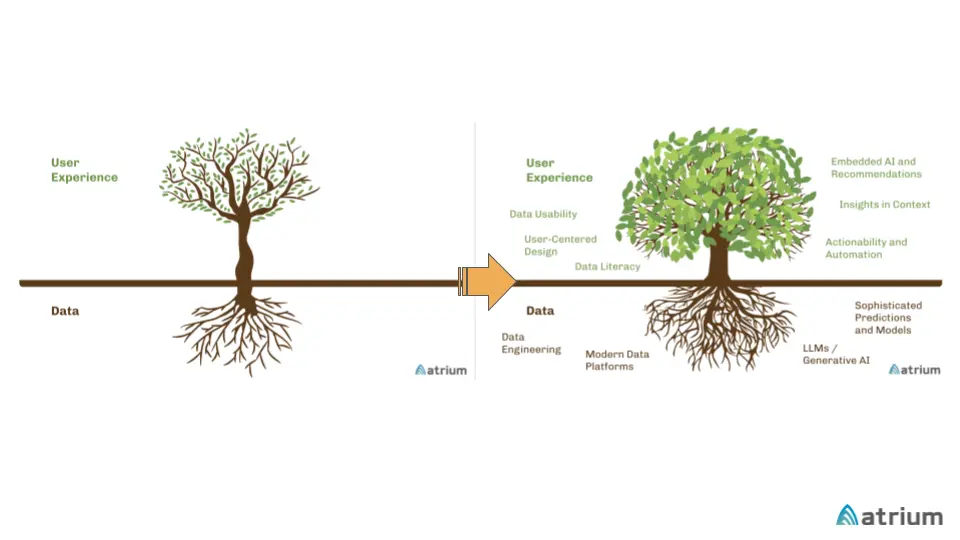
If your tree has an expansive root system, but has not converted that into a beautiful canopy, it’s wasting all of its energy spent on that foundation. Conversely, if it has a beautiful canopy but doesn’t have the root system to support it, many of those leaves will eventually wither and die. The two must remain in concert.
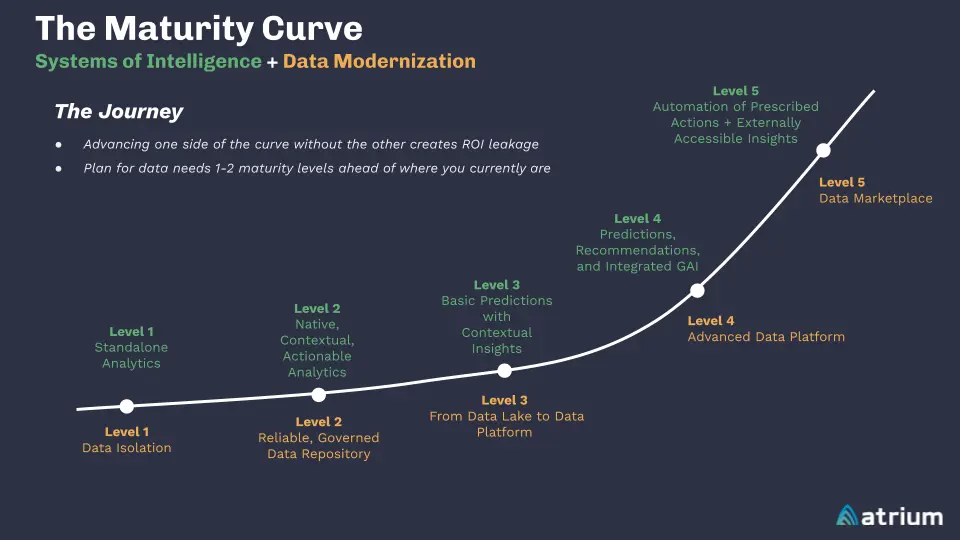
Moving up the curve on your analytics maturity model journey: Systems of intelligence and data modernization
Before we talk about how to structure work to move your organization up the maturity curves, let’s take a look at each in some detail.
Starting with user experience (or what we often like to call “systems of intelligence”), we focus on the ability to consume well-structured data in the context of an end user’s day. As you move up the curve, the consumption of that data becomes more advanced while simultaneously becoming a more integrated part of an end user’s day.
It should be noted that these curves are constantly evolving as technology advances. But as a representative baseline against which you can measure you organization, refer to the following levels:
Level 1: Standalone analytics
Over the last 25 years, most companies made the investment in some type of data analysis product. However, the original tools that hit the market were separate and isolated, and we commonly see some decent reporting that, unfortunately, is either hard to find or requires swivel-chairing out of the flow of work to find a piece of information.
Level 2: Native contextual, actionable analytics
We’re now getting to what I would consider the minimum level at which any modern company should be. You have meaningful insights, and they are incorporated into the flow of work. They also have an action framework surrounding them, allowing users to swiftly take action based on the answers they find. At Atrium, we most often build this type of solution on the Salesforce platform, marrying embedded CRM Analytics or Tableau dashboards and combining them with custom quick actions or Salesforce Flows.
Level 3: Basic predictions with contextual insights
The curve starts to get steeper here as we move from descriptive analytics into predictive analytics. Instead of backward-looking analytics, we leverage all of the data we have to create some initial data modeling around common use cases. Now, instead of our reps being solely responsible for determining the probability of an opportunity to close or the attrition risk of a customer, we have a model providing a point of view and helping to streamline the efficiency of a user’s day.
Level 4: Predictions, recommendations, and integrated generative AI
Here, we move from basic predictions to prescriptive analytics (i.e., not just telling you what is likely to happen but also recommending what you should do about it). In addition, we look at ways that we can incorporate generative AI into the flow of work. In short, end users are interactive with their modeled insights and continuing to increase their productivity.
Level 5: Automation of prescribed actions and externally accessible insights
At a point, the recommendations provided by the model become so consistent and the users become so confident in those recommendations that they can be automated. When there are more things to do than there is time in the day, this is the equivalent of a user offloading a low-level task and letting AI handle it for them while they focus on all the other decisions that require human input.
Where are you on the systems of intelligence maturity curve?
It’s a wide swath when you look at it end to end, isn’t it? So understanding that path, where does your organization reside? If you’re below Level 3, you should consider yourself well behind the market and your competitors. If you’re somewhere in the 3-4 range, you’re probably pacing (but certainly not leading) the market. Leaders are at least between Level 4 and Level 5, and are primarily focusing on how to automate their productionalized models and take best advantage of the power of Generative AI.
Shifting our focus to the data modernization maturity curve
Here, we see some similar patterns. Early levels represent antiquated or immature approaches today, and as you move up the curve, data increasingly becomes accessible and structured to support systems of intelligence (and beyond).
Level 1: Data isolation
Data is accessible, but to get to it is hard. Every query requires a request, and work to be done, and takes days to complete. The system may have dozens of queries that pull the same information, due to ad hoc requests and lack of standardization or governance. This might be an aging on-premise data warehouse.
Level 2: Reliable, governed data repository
Like with the Systems of Intelligence side of the curve, we’re now at what I’d consider the “minimum viable data maturity” needed to function and compete today. A functioning data warehouse or even data lake is present, and some self-service capabilities exist, although they may be fragmented. Also, it is not broadlyself-service, meaning the only people with access to the data are either members of the data team, or possibly business intelligence-focused team members from certain business teams. And while they may have access to the warehouse, they still have to write all of their queries ad hoc. Data is static and backward-looking only, and only supports descriptive analytics. No predictive models exist.
Level 3: From data lake to data cloud
Data sharing and rapid deployment of new data sources on a data platform or data cloud, such as Snowflake’s Data Cloud. Data is accessible by the people that need it without requiring a burdensome request process. A streamlined governance process is in place to prioritize and schedule swift development of new data sources according to a set of standards. Rogue data stores and requests have been eradicated, and data exists in a medallion (i.e., bronze/silver/gold) model that is operating well.
Level 4: Operating enterprise single source of truth for AI, machine learning, and generative AI
At Level 5, we build on the solid foundation to have a fully effective and modern data platform acting as a single source of truth for the organization. Data and logic exists in a mature medallion (i.e., bronze/silver/gold) model that is functioning well, and the data platform is being actively used to support a mature set of data models. Predictive data maturity matches descriptive data maturity. The data platform contains data products beyond views — governed artifacts like reverse ETL and external data shares.
Level 5: Data marketplace
Once an organization has their data in a modernized configuration with the appropriate governance, it opens doors to the world of data monetization. Depending on a company’s industry, privacy policy and the ability to obfuscate sensitive data, as well as the value of their data, the next level of maturity is to capitalize on the investment you have made in data by making extracts available for paid consumption on a data marketplace.
Avoiding ROI leakage
So, are you in alignment? If you are, congratulations! Most organizations skew one way or the other, and as a result they experience what I like to call “ROI leakage.” Overinvesting in one half of the curve means you’re not seeing the full realization of that investment, because the complementary half of the curve isn’t at the same level. More often than not, companies embark on major initiatives that result in a continuous game of leapfrog.
Lessons learned: Analytics maturity model pitfalls
For example, let’s take a company that evaluated their data landscape and recognized that consolidating and standardizing on a single source of truth for data in Snowflake was paramount to their success. A multi-year, multi-million dollar initiative was funded to build out a data strategy and unify the data in Snowflake. Analytics and models that would use that data in new ways — the Systems of Intelligence half of the curve — were tabled as something to consider once the data was in place.
Fast forward two years, and the rationalized Snowflake data is approaching completion, but no work has started on the dashboards, embedded insights, and predictions that could benefit from that data. The company is where they need to be for data, but they left the rest behind. And as a result, they will fail to see the full impact and return on their data investment in a timely manner.
In many cases, this then leads to a massive visualization project, which then causes the Systems of Intelligence maturity to leapfrog Data Modernization maturity, and the cycle continues (and the ROI continues to leak).
I’ve also witnessed several instances of another scenario that I’m sure will sound familiar to many. Take, for example, a company that funds a massive initiative around replatforming. In order not to “bite off too much” or “get to MVP,” analytical needs are tabled for a future release. The company ends up investing millions in a system that keeps them at Level 1 on the maturity curve.
Furthermore, rather than starting on some of the data work to support Level 2+ analytics in conjunction with the replatforming project, that is tabled as well, creating an even longer pathway to seeing a return on that system investment.
Next steps for success with your data strategy
What should you do with this guidance around your analytics maturity model? An honest assessment of where your organization lands on each curve is a great place to start. Understand if you’re in or out of alignment, and then reach out to us at Atrium to craft a strategy. We can help you bring the organization into alignment and set targets on how quickly you wish to move up the maturity curves.
Learn more about our data strategy services to help you wherever you are on your analytics journey.
