

How to Create an Anonymous Leaderboard in Tableau CRM – Part 1
One of the most common questions I get asked when designing dashboards is, “How can I include a leaderboard in Tableau CRM so my sales reps can see how they rank among their peers?” My response is always, “That’s easy! All you need to do is create a bar chart.”
The customer almost always comes back saying, “Great, but it needs to be anonymized. Is that a problem?” Until about a year ago, I would’ve said, “Oh yeah, that’s a challenge.” But now that I know the secrets of Tableau CRM, it’s not a challenge at all!
Let’s get started. The first thing I said to my customer was correct; all we need to do is create a bar chart. But it won’t be ordinary. Unlike most bar charts, this time, we’ll need two data streams to create it.The reason for this is simple. When a user logs in, we only want them to see their own name, correct? Every other person should be anonymous. In order to do this, we need to create two data streams:
- One for the logged-in user.
- One for all other users, anonymized.
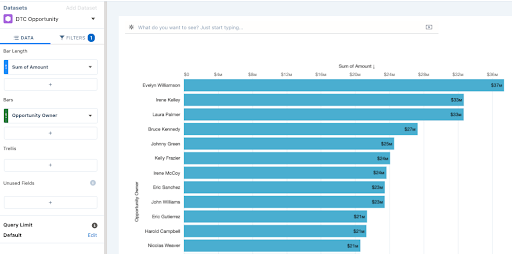
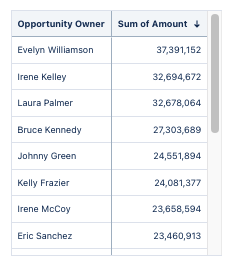
Start by creating your leaderboard in a lens. For this tutorial, we are using the DTC Opportunity Dataset in a Salesforce Developer Org.
Make sure you add all the filters you need in your leaderboard. I’ve only included Closed – Won opportunities for this example. Make sure you group your leaderboard by the Owner Name, and order your measure descending.
Great! We have a pretty awesome leaderboard going! But we still need to make sure we anonymize every name other than the logged-in user.
What we need to do now is create the two separate data streams and combine them into a single leaderboard.
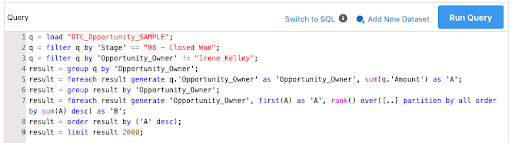
The first stream will include all owners except the logged-in user, while the second will include only the logged-in user. If you’ve already spent some time in Tableau CRM, you’ll know when we need to combine two different data streams we’re going to have to hop into some code! Let’s enter the SAQL. Your code should look like this:
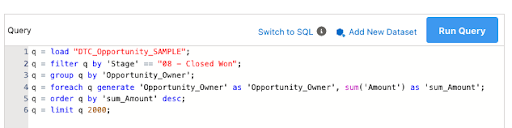
Let’s add an additional filter into the query, excluding “Irene Kelley.”

Don’t worry about Irene — she won’t be left out of the finished product! We need to add a preliminary filter that we can eventually edit to add the logged-in user.
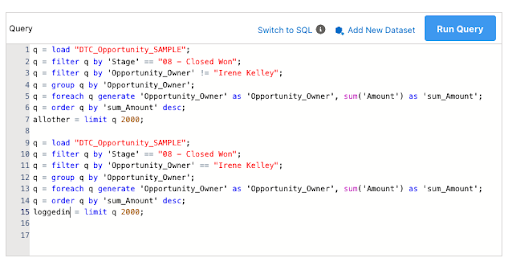
Now let’s create that second data stream by copying the first data stream and pasting it below. Let’s replace that filter we added last time, excluding Irene, with one that includes only Irene. This will be our placeholder limiting the second data stream to only show the logged-in user.
Finally, let’s rename the final “q” in each of the data streams. Doing this will prevent Tableau CRM from saving over the first data stream when you create the second. I’ve named the first stream “allother” and the second “loggedin.”
Now it’s time to combine each data stream into one single stream. In Tableau CRM, we have two options to do this: a cogroup and a union. But which one do we use?
Well, we know that we don’t want to exclude Irene from the final leaderboard, we want to add her column to the list of other columns. We want to append her column to the other datastream. This means we want to use a union in Tableau CRM.
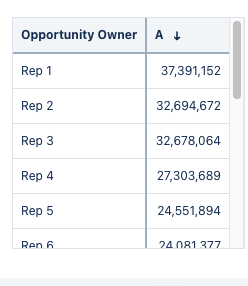
Unions are simple. All we need to do is tell Tableau CRM to union the two datastreams (line 17 below) and then use a generate statement to output the two fields we need — Opportunity Owner and Sum of Amount (line 18 below).
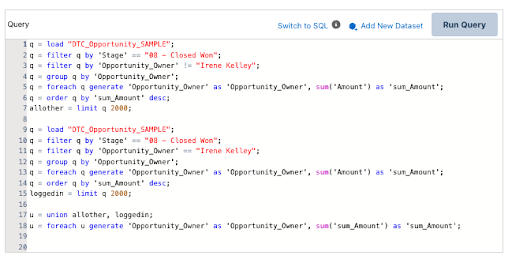
Our output should look something like this:
But wait, weren’t we trying to anonymize the other values in the leaderboard? You’re right. All we did was make a more complicated version of the first chart we created. Let’s take a step back and think about what we want this chart to look like.
We know we want the logged-in user to see only their name. And we also know that we want every other name in the chart to be anonymous. What we need to do now is rename all those opportunity owners in the first data stream.
Let’s go back to our first data stream. We know we need to make these names anonymous, but if we give every anonymous opportunity owner the same name, Tableau CRM will group them all together! We can’t have that.
Instead, we can use a windowing function called “rank” to break up those reps. Let’s go to a new lens to create that function.
Start by setting up the lens the same way we did before, adding Opportunity Owner in the Bars section and adding sum of Amount in the Bar Length. Don’t forget to add filters for ‘StageName’ == “Closed – Won.” This time, under the Bar Length, click the “+” and “Add Formula.”
Click on the “f(x)” and select rank within group. This will give a ranking to each individual in our table. We’ll leave all the defaults here, which will give us a new column called “Rank.” Hit apply.
Awesome! Now that we’ve added this column, we’re just one step away from creating that anonymous leaderboard.
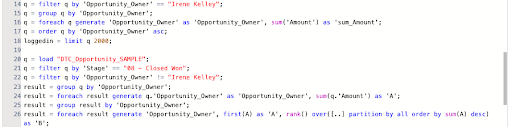
Hop over to the SAQL, and see what we’ve created. You’ll see that because we used the windowing function “Rank,” Tableau CRM needed to group twice, which allowed the rank function to perform calculations on the grouped rows.
Now let’s add one more row below our rank formula where we can create those anonymous names. Copy the foreach statement and add in the following code:

This function will allow us to anonymize the names of the individual reps, while keeping the value of the amount sold. Your output should look something like this:
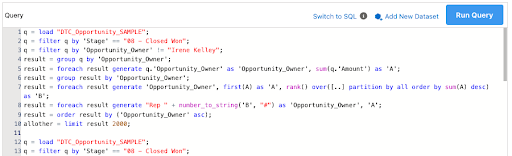
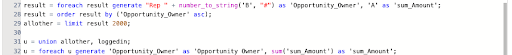
Great, we’re almost there! Let’s copy this code into our original query, replacing the first full query we executed. Before we run the query, we need to make sure that we rename the last line of our new query to “allother” the way we did before.
Also, we need to make sure that our union is grouping the same field between both the allother and logged-in queries. Let’s rename ‘A’ to ‘sum_Amount’ in line 9 (also making sure to rename the ‘A’ in the order by line).
Lastly, we need to add in our exclude “Irene Kelley” filter. Paste this up in line 3:

Let’s take a look at our code before we run it.:
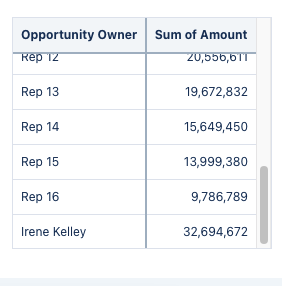
Your output will look something like this:
Awesome! We’re almost there. Before we add the dynamic filter to hide all by the logged-in user’s name, let’s add one more line to our code.
At the very end of our union, let’s put an “order by” statement so that Irene Kelley shows up where she should in order. Let’s order u by ‘sum_Amount’ descending.
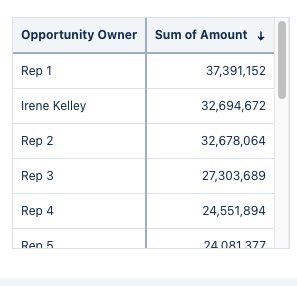
Excellent! Now we have Irene Kelley coming in second place.
We’re almost done! It’s time to add the ability to dynamically filter for the logged-in user. In order to do this, we’ll need to pull this table into a dashboard. Let’s create a new one and pull in our anonymous leaderboard.
Once you’ve done so, you’ll need to create a Salesforce Direct query. To do this, click any blank space on the dashboard and then click “Create Query” in the top-right corner. Select Salesforce Object and type “User.” Add a Full Name filter the way we did before only including “Irene Kelley” and hit “Done.”
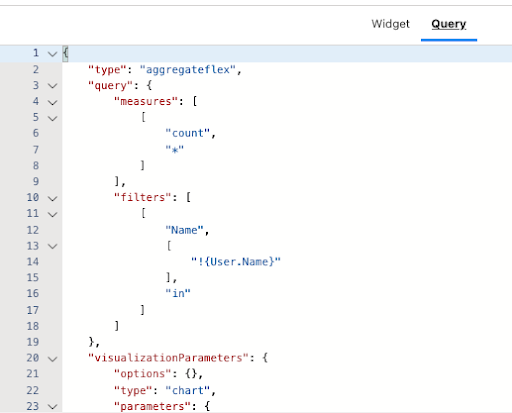
Right now, our query is trying to tell TCRM to filter the dashboard to only see Irene Kelley’s information. We need to make this dynamic! To do this, we need to dive into the advanced editor for that Salesforce Direct Query we just created. Click once on your query and select “Advanced Editor” in the top-right corner. Switch front the “Widget Tab” to the “Query Tab.” Find Irene’s name and replace it with “!{User.Name}”. This function will tell Tableau CRM to only look at the logged-in user when viewing this dashboard. Here’s a view of that modified Salesforce Direct Query:
Great! Just one more step, we need to tell the leaderboard to do what our Salesforce Direct query is doing, filtering to the logged-in user. Click into the advanced editor on your leaderboard graph, click the query tab, and find Irene’s name. This time in the advanced editor, because we’re in a SAQL query, we’ll need to type !”User.Name”. The backslashes tell Tableau CRM that these quotation marks are needed to read that user’s name as text, the same way we filtered for Irene Kelley in SAQL earlier.
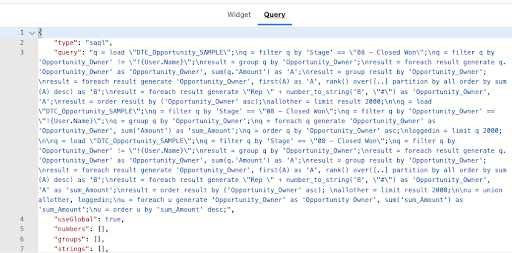
There you go! You have a leaderboard that will anonymize all reps with the exception of the logged-in user! Take a look below for the finished code in the advanced editor:
Also, make sure to check out part 2 of this series where we will move beyond an anonymous leaderboard to show you how to reveal where your sales reps rank!
Learn more about our expertise and how we can help you get more out of Tableau CRM.
