


Learn From the Experts: The Consequences of Missing Data
Welcome to another post in our ongoing Expert Insights series on data quality. This series serves to illuminate common data shortcomings and their consequences. For a general overview of data quality, be sure to check out the initial post in the series. This post concludes our last post on how data go missing.
For our fictional Acme Corp case study, we simulate each of the three missing data scenarios described in the last post, use the available data to train a logistic regression model, and compare the resulting predictions to the model trained on the full dataset.
Consequences: Benign to Dire
Here are the ways in which Acme’s training data become missing in each scenario:
- Randomly Missing: Each account has a 30% chance that some piece of information is missing and it is omitted from the training dataset.
- Source-Related (Predictor) Missingness: Each web-sourced account has a 90% chance that the profile is incomplete and it is omitted from the training dataset.
- Churn-Related (Outcome) Missingness: Each churned account has a 50% chance of being unreachable when Acme tries to obtain information and is omitted from the training dataset.
Each of these scenarios results in roughly the same size training dataset (Table 1), but they provide the model with very different information.
| Outcome | Complete Data | Randomly Missing | Source-Related Missingness | Churn-Related Missingness |
|---|---|---|---|---|
| Will not churn | 4,402 | 3,109 | 3,529 | 4,402 |
| Will churn | 5,998 | 3,888 | 3,500 | 2,785 |
| Total | 10,000 | 6,997 | 7,029 | 7,187 |
| Table 1: Number of customer records used for model training in each missing data scenario. | ||||
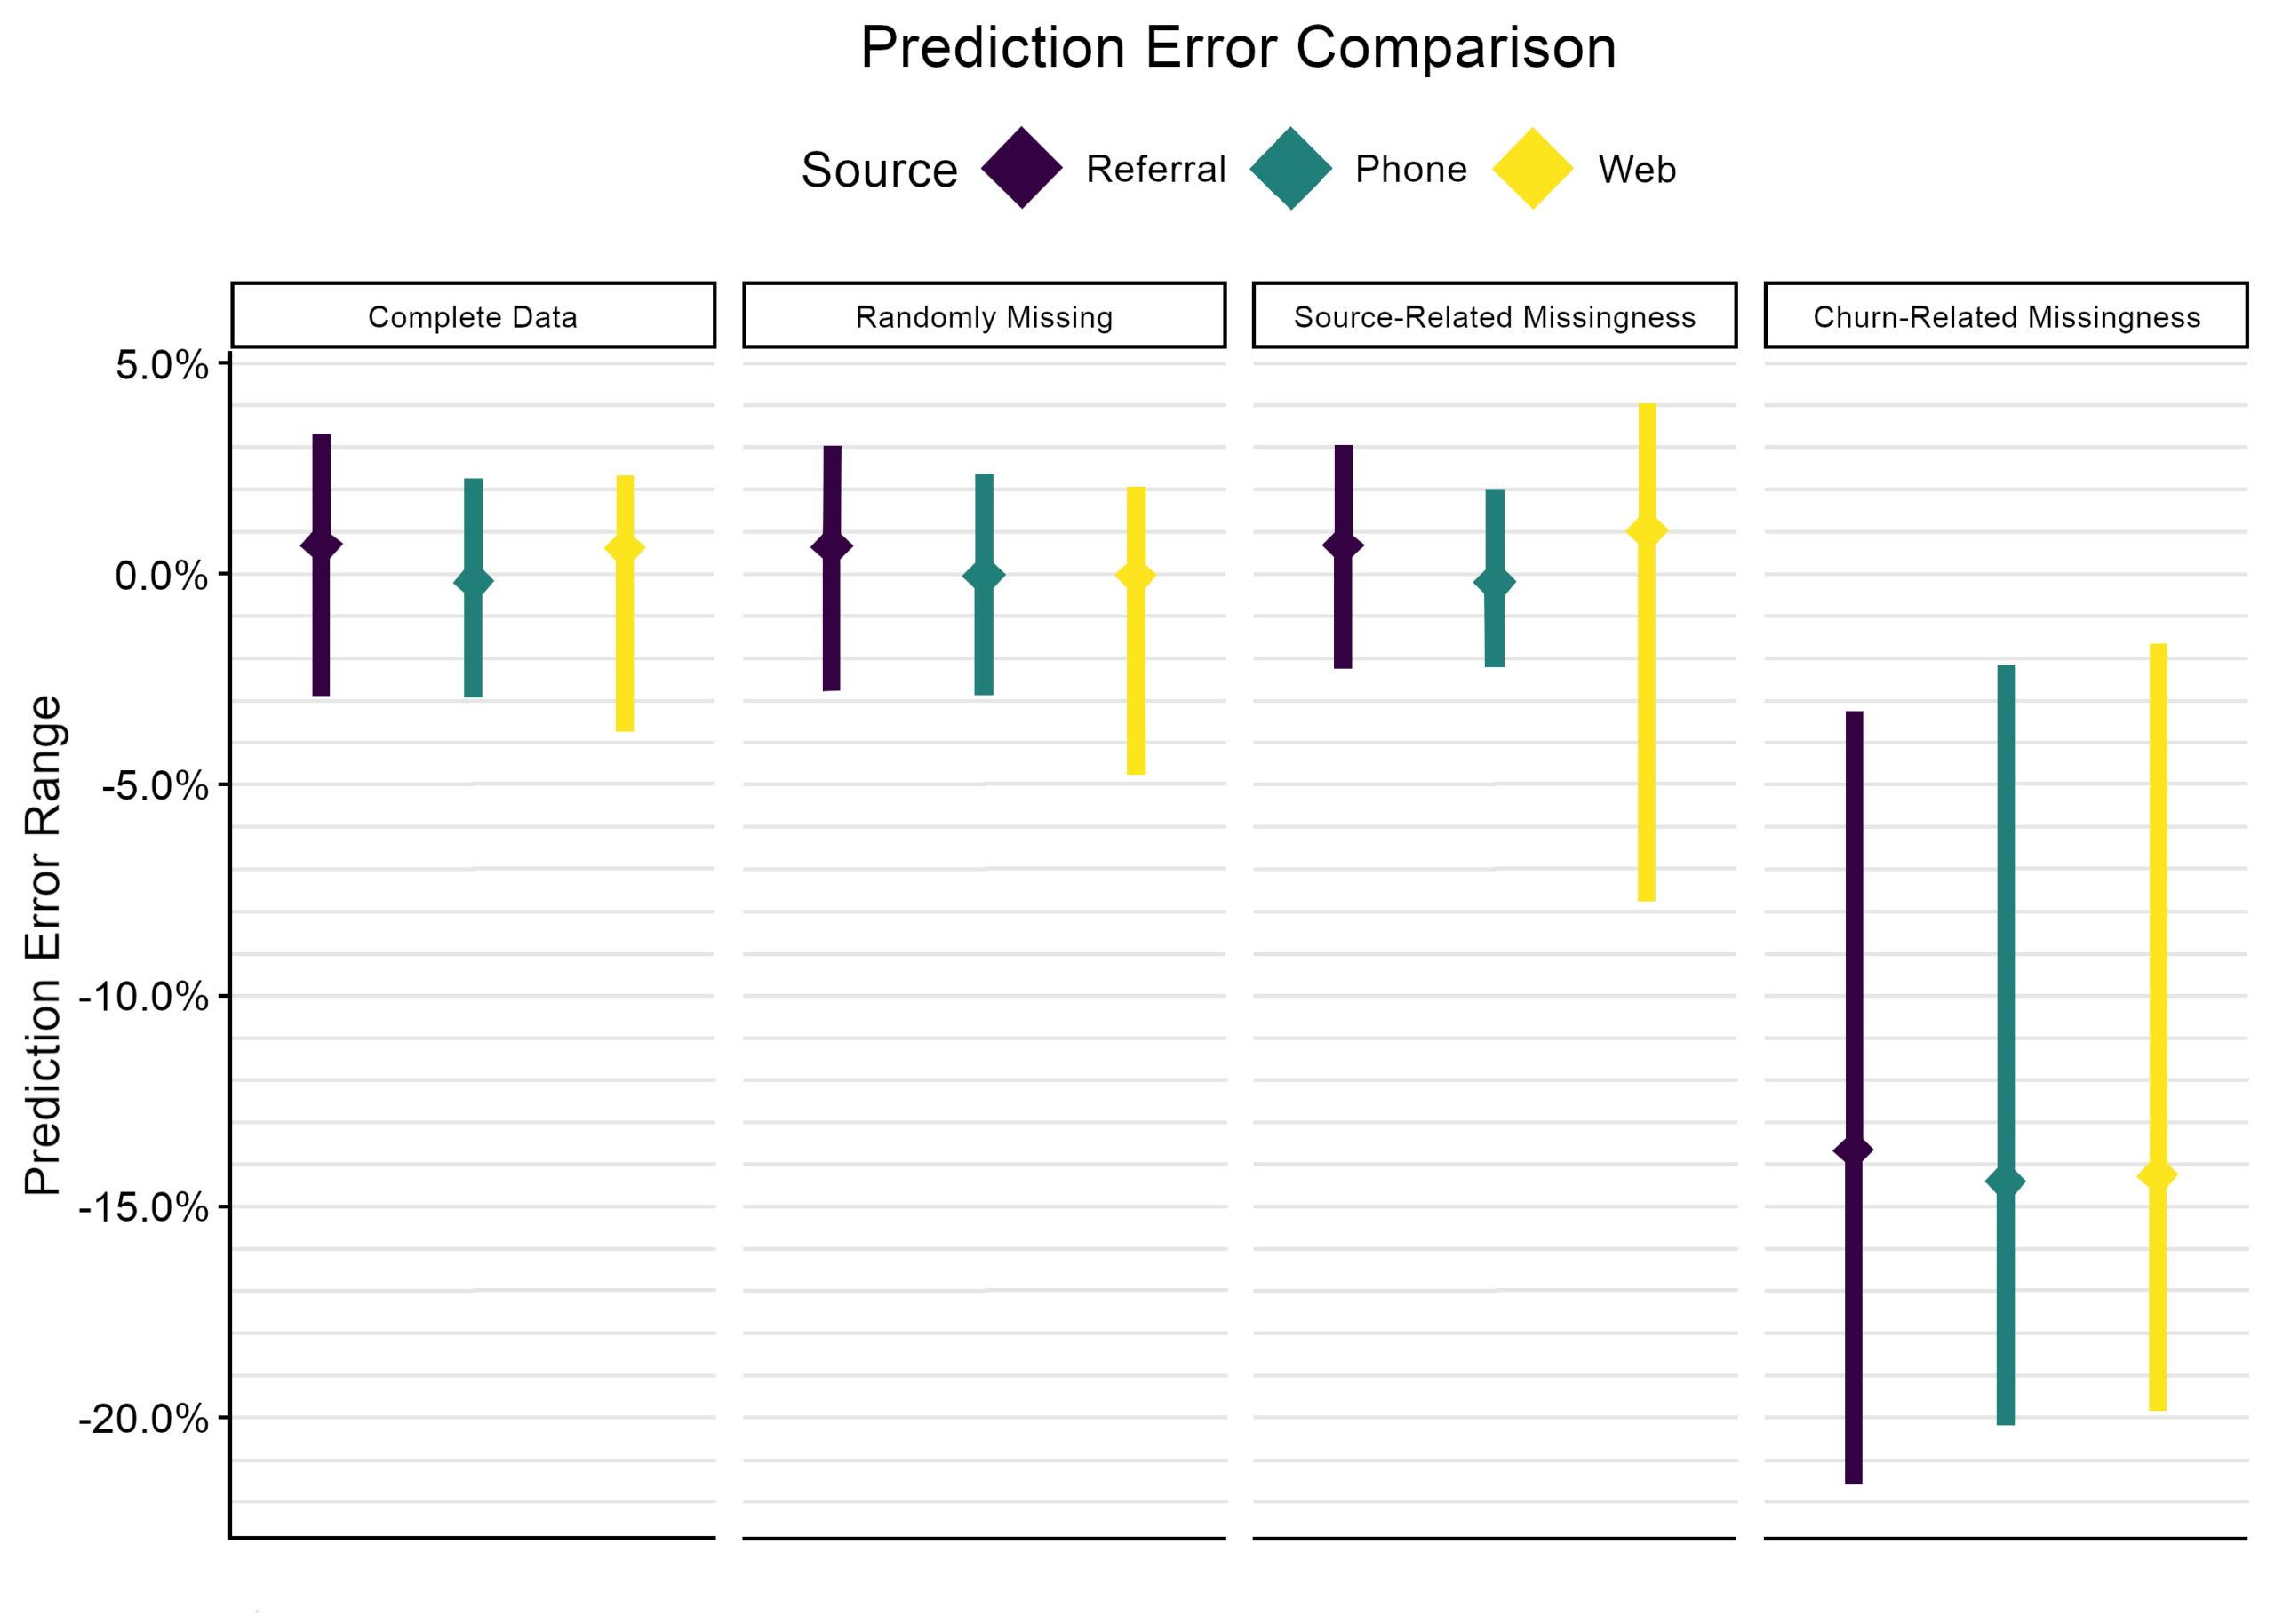
Because we simulated the data and thus know the true churn probabilities, we can examine the prediction error at the level of individual customers. Figure 2 visually summarizes the results in terms of prediction error, showing the range of prediction errors for customers from each source along with the average prediction error per source. For the complete data and randomly missing scenarios, the prediction errors are close to zero, meaning that the propensities are approximately equal to the true probabilities. For source-related missingness, the range of prediction errors for web accounts is much wider, and on average the propensities are overestimates. For churn-related missingness, all sources have wide ranges of prediction error and all propensity scores underestimate the true probability of churn. We further dig into these results and their consequences below.
Complete Data and Randomly Missing
When the model is trained with the complete set of 10,000 records, it performs as expected. Some churn probabilities are overestimated, some are underestimated, all predicted propensities are within ±4% of the truth, and most are closer than that.
When approximately 30% of the training data are randomly discarded and the model is trained on the remaining 6,997 records, the results are barely different from the complete-data scenario. A handful of outliers that were not described well by the first model get more extreme prediction errors this time. Overall, the extant data form a representative sample and 6,997 records are still enough to train this model adequately.
Missing Because of Source
When web accounts are underrepresented in the training dataset, the result is considerably more variability in the predicted churn propensities for web leads. Most web accounts’ propensities are overestimates, but some are extreme underestimates by nearly 8%. Predictions for referral and phone-sourced accounts are practically unaffected.
This is a case of poor model fit owing to nonrepresentative training data. Accounts with extreme underestimates may be passed over as intervention targets, while overestimation will incorrectly prioritize web accounts over other at-risk accounts.
Missing Because of Churn
When churned accounts are underrepresented in the training data, the result is that the model drastically underestimates the overall churn rate. Every account’s predicted propensity is too low, some by more than 20%.
The consequence is that the model provides a misleading picture of the severity of the churn problem. It can still help to prioritize targets for the intervention, but the predicted propensities are so low that Acme could erroneously decide to reduce the effort they put into the intervention. Downstream uses of the churn predictions (e.g. adjusting revenue forecasts for expected churn) will also be impaired.
Uniting Data and Strategy for Our Customers
Today, we took a deep dive into the consequences of missing data. Obviously, the data used to train machine learning models have profound impacts on the predictions and insights gained from the models. But, as our case study shows, the data that do not make it into the training set are equally important. Whenever relevant data are missing, it is crucial to think critically about why those records are unavailable, what patterns may exist, and what effect those patterns could have upon machine learning models.
At Atrium, we bring fresh perspectives and new questions to enterprise data science. We are leading in uniting data and strategy. In doing this, our customers gain a complete view of the role of data in their organizations. Stay tuned to our Expert Insights series as we continue to illuminate the hidden challenges of data quality.
Is your organization plagued by null values or other data limitations? Contact us to discuss how to get your data pipeline flowing.