

March Madness: Rating NCAA Basketball Teams with Einstein Discovery
Ah, March. Winter’s icy grip is fading; spring is just around the corner; and the sights and sounds of college basketball are quickly approaching. Who doesn’t love a little March Madness? In Spring 2020, Atrium’s Data Science team asked a question: what if we used Einstein Discovery to build a model to identify the best teams in the NCAA tournament?
We all know how that turned out. The tournament was canceled due to the initial onslaught of COVID—an outcome that no model, no matter how good, could have predicted.
Well, fast forward two years and basketball’s back, baby! Along with it is our curiosity to find out how well Einstein Discovery can predict and identify indicators associated with winning games. Who knows, perhaps I’ll finally win the office bracket competition!
In this blog post I will discuss the process of building a model to predict college basketball wins and losses, covering everything from the data wrangling necessary to make this work, the model in Einstein Discovery, and our predictions for the NCAA tournament.
Einstein Discovery Models and Tools
First, where do we get the data? Kaggle.com maintains a yearly competition called March Machine Learning Mania. They have data pertaining to previous NCAA regular season basketball games, tournament outcomes, and other details that can be used to build a top-notch predictive model.
Structuring the data is the biggest challenge. For building a training dataset, we opted to do most of our data manipulation and ETL using R; however, this sort of thing can be done in a plethora of tools like SQL, Snowflake, and Python. It’s said that for most data science-oriented projects, the majority of the work isn’t spent building the model, but instead on identifying, cleaning, and combining data sources and data sets to build a high-quality training dataset. In this case, it’s no different.
Kaggle’s raw data contains results going all the way back to 1985 with more than 370 teams represented over that span. For this model, we focused on building a dataset with game-level details for each team just over the previous five year period from 2018-2022. While we might have benefitted from looking at a longer time frame, we didn’t want to consider seasons where the rules or team dynamics were drastically different from what they are today.
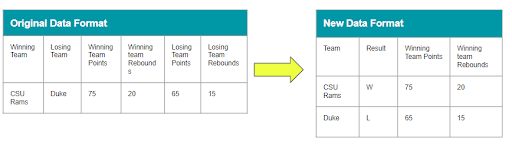
The final training dataset has two records for each game played – one for the winning team and one for the losing team. To build our model, we need a clearly-defined response variable so that the model can clearly distinguish between wins and losses. We created a field called “Won” that takes a value of 1 for the team that won the game and a 0 if the team lost. Because of this binary (win/loss) response structure, we’ll want to use a so-called “logistic regression” model that is built to predict this type of yes/no outcome.
The final training dataset contains 47,574 records over that time span, with 21 different columns (features) that we can use as predictors for the model.
Extracting Intuitive Insights with Einstein Discovery
Einstein Discovery is a great tool for creating logistic regression (and linear regression) models because it makes the process of actually building the statistical model a point-and-click process. While you still have to understand the data and clearly define your goals, you don’t have to have a PhD in Statistics or Computer Science to build a robust predictive model using this tool.
We uploaded our dataset to TCRM and built an Einstein Discovery story using the following predictors:
- Average Points Scored
- Field Goal Percentage
- 3 Point Field Goal Percentage
- Free Throw Percentage
- Defensive Rebounds
- Offensive Rebounds
- Assists
- Blocks
- Turnovers
- OT
- Season
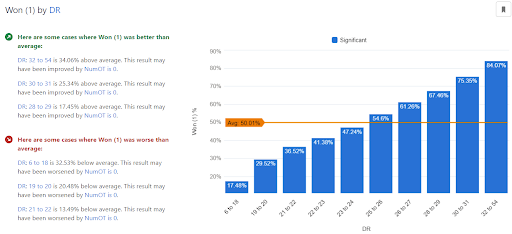
Running the model in Discovery, we can see some pretty intuitive results: higher scoring teams tend to win (no big surprise there) and teams that make a higher percentage of their shots (both 2 pointers and 3 pointers) are more likely to win. Along with that, teams with higher numbers of defensive rebounds and assists are expected to win at higher rates.
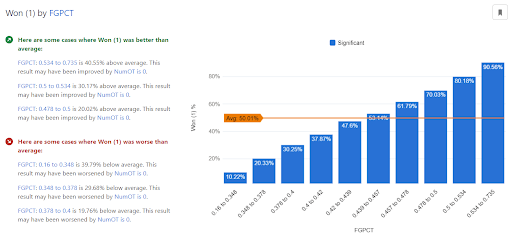
An interesting nuance of the model in Discovery is that it uses 2-way interactions to better disentangle the impacts of different features in the model. This can be a powerful tool that uncovers some interesting insights.
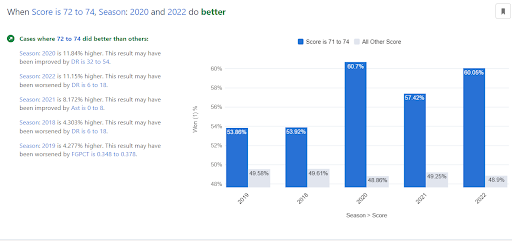
For instance, the data is structured so that the main effect of Season is not statistically significant. However, when considering the 2-way interaction between Season and, say, points scored, we can actually see that the impact of scoring efficiency differs somewhat from one year to the next. Figure X actually shows that for teams scoring between 72-74 points in 2018 and 2019, predicted win probabilities were 7-10% lower than in 2020 and 2022.
Experience Framework
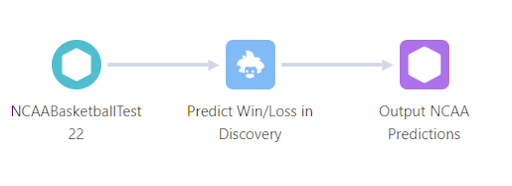
Building the model is only half the equation. We believe that even the best predictive model is only valuable if the predictions it generates are used by the right people at the right time. To get a sense for which teams have the highest ratings going into the NCAA tournament, we first needed to deploy our Einstein Discovery model and use the Einstein Discovery Prediction Node to score every game of the 2022 NCAA season.
Once we have those scores sitting in a Tableau CRM dataset, we can build a dashboard that shows the scores for each team.
There’s just one problem. We don’t want to surface scores for each game played, we want a single number to represent the relative strength of each team in the tournament. To generate our team rating, we took the median of each of the team’s predicted likelihood to win each game.
For example, if Colorado State had 4 games played in 2022 as shown in Table 1, we’d assign a score of 77.5%.
| Table 1: Example of 4 Games | |
| Game | Einstein-Predicted Likelihood to Win |
| 1 | 75% |
| 2 | 40% |
| 3 | 80% |
| 4 | 90% |
| Median Score | 77.5% |
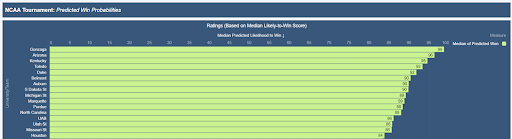
Based on our model-based ranking of teams, we can compare our top 25 teams to the AP and Coaches Poll on ESPN, shown in Table 2.
| Table 2: Einstein-Ranked and Top-Ranked Teams in College Basketball | |||
| Rank | Einstein-Based | AP Top 25 | Coaches Poll |
| 1 | Gonzaga | Gonzaga | Gonzaga |
| 2 | Arizona | Arizona | Arizona |
| 3 | Kentucky | Baylor | Baylor |
| 4 | Toledo | Auburn | Auburn |
| 5 | Duke | Kentucky | Kentucky |
| 6 | Belmont | Kansas | Kansas |
| 7 | Auburn | Duke | Duke |
| 8 | South Dakota State | Villanova | Villanova |
| 9 | Michigan State | Tennessee | Purdue |
| 10 | Marquette | Purdue | Providence |
The Complexity of Predictive Models Is Limitless
When it comes to building predictive models for sports, there’s virtually no limit to the amount of complexity that you can add. Kaggle’s Machine Learning Mania tournament routinely provides a foundation for some innovative algorithms, complex custom models, and fascinating ideas. FiveThirtyEight’s brackets are based on an online, constantly-updating rating called ELO, which is related to the type of modeling that we’re doing in Einstein.
Beyond making the algorithm more statistically complex, another path to better predictions is possible: adding more insightful data to the model. Our model does not consider the impact of an opponent. While Gonzaga may be predicted to beat the average opponent 99% of the time, they probably have a lower likelihood of beating a top-flight program like Arizona. Additionally, it doesn’t account for the historical quality of each program, a factor that might impact a team like Gonzaga, Kansas, or Duke.
It’s also worth taking this all in its proper context. Predicting the NCAA tournament is actually a very difficult problem – much more so than many of the problems that Salesforce customers face trying to better understand sales processes or predict business outcomes.
Why is this the case? Well, for one, statistical models tend to predict the average outcome from a process. Predicting an outcome from a single event can be a much trickier endeavor. As an example, think about flipping a coin. We know that approximately 50% of the time, that coin is going to come up heads. But it’s not out of the question that I could flip a coin 10 times and it return “tails” all 10 times. In that same way, a model might predict a team like Virginia to beat a small school like University of Maryland Baltimore County 95% of the time, but that’s hardly a certainty – even though the odds may not look good. As Lloyd Christmas would say, “so you’re saying there’s a chance.”
Using Einstein Discovery To Help Your Business
It’s fun and interesting to use tools like Einstein Discovery and Tableau CRM to predict NCAA basketball outcomes, but these tools are even better when helping you make better business decisions. Combining Einstein with a breadth of CRM data in Salesforce can help organizations drive smarter decision making, enhance lead and opportunity conversion, reduce customer churn, and make accurate forecasts.
Want to start down the road of building out intelligent CRM solutions? We are here to help. Get in touch with us.
