Multiple Toggle Selection Binding: Tips and Tricks You Should Know
Widgets are one of the main components of a dashboard. In Einstein Analytics, the toggle widget
gives us the ability to make a dashboard view multi-select. When this requirement came my way in a recent implementation project, I was fascinated. In this blog post, I will explain how you can use this feature in your dashboards. Let’s get started!
I have created a sample dashboard that I want to modify using multiple toggle bindings.
In my sample dashboard, I want to do the following:
- Add a toggle that filters the chart by Forecast Category as Closed/Not Closed or Both in standard JSON.
- Add a toggle that filters the chart by Forecast Category as Closed/Not Closed or Both in the chart query that is in SAQL form.
Standard JSON Toggle Binding in Filters
To get started, we need to create a chart with the required dimensions and measures.
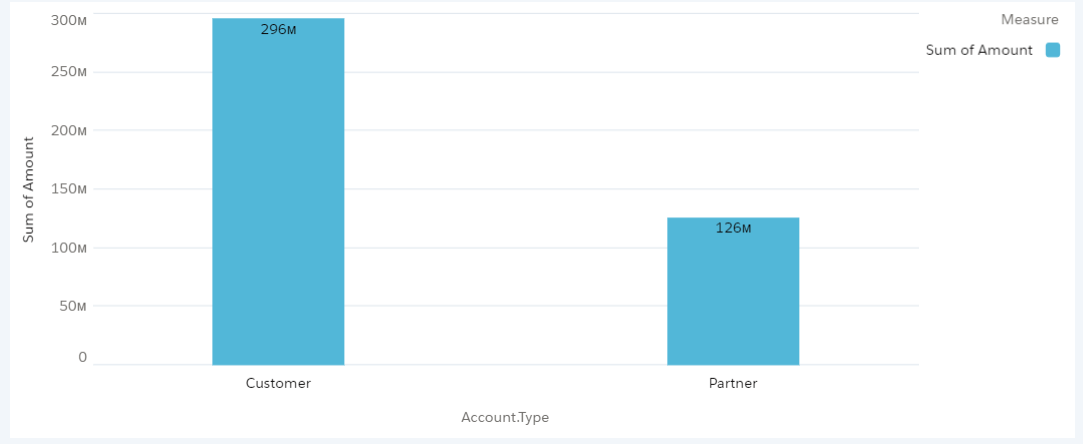
Step 1: In the image below, we have the sum of Amount grouped by Account Type with filter applied on Forecast Category == “Closed.”
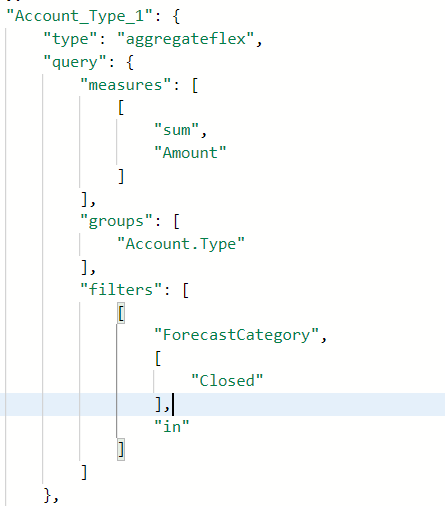
If you copy this snippet into JSON, your chart will look like this:
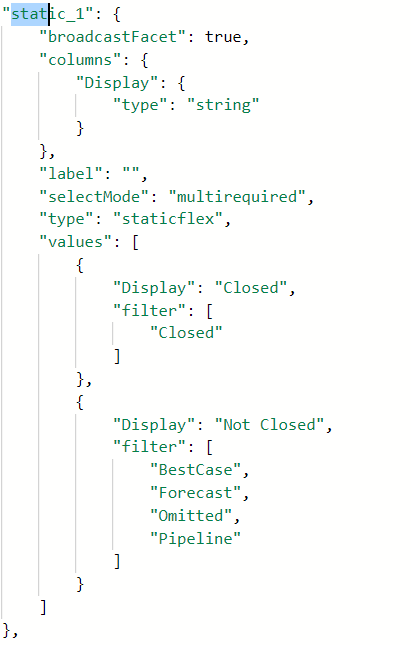
Step 2: Now add a toggle that has following values:

Change the toggle to multiple selection required in properties.
Step 3: Now, it’s time for that amazing binding to be done in JSON.
Take:
And replace it with:
Column Function: Returns multiple columns of data as a two-dimensional array.
Flatten Function: Flattens a two-dimensional array into a one-dimensional array.
This is why we will use the flatten with column function — so that we can cast multiple selected values into 1-D array so that filters can work the way they are.
So our JSON query will look like this:
If you want to check how your bindings are working in turn, select both the toggle and click on the drop down arrow and select Show Details.
This way you can use the Multiple Selection in the Toggle widget in the standard JSON query.
SAQL Query Toggle Binding in Filters
For this, start by creating a chart and binding it to the toggle. The query should be in SAQL form.
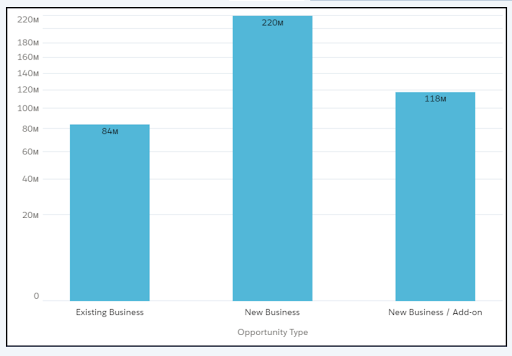
Step 1: In the image below, we have the sum of the amount grouped by Opportunity Type, with filter applied on Forecast Category = “Closed” in SAQL query form.

How to make a SAQL query:
- Create a chart with desired requirements.
- Go to SAQL editor.
- Edit the query the way you want. (You can remove the limit statement.)
- Run the query and here you go.
- Check the JSON of the chart and you will notice that the query has turned in SAQL form.
If you copy the above code snippet into JSON, your chart will look like this:
Step 2: Create the toggle the same way we did above.
Change the toggle to multiple selection required in properties.
Step 3: Finally, time to do binding in the SAQL query.
Take this in the query:
And replace with:
This time we are serializing the binding using asString() function.
The final query will look like this:
Here we go — you can now see that both the charts are binded with the toggle and multiple selections are working on both.
Check your query by clicking on Show Details like we did above.
Screen capture of binding working on both the charts:
What we learned
- Understanding of flatten function.
- Understanding of multiple selection in toggle widget.
- How multiple selection works.
- How to bind the steps with Flex query (Standard JSON query) and SAQL query.
Try it for yourself. Happy learning!
Subscribe to our blog to keep up with our latest technical tips and industry news.