


Learn From the Experts: How Data Go Missing, Explained
Welcome to another post in our ongoing Expert Insights series on data quality. This series serves to illuminate common data shortcomings and their consequences. For a general overview of data quality, be sure to check out the initial post in the series.
Cloud-based CRM promises to automatically fill databases with immense volumes of data just waiting to deliver machine learning-driven business insights. Unfortunately, that promise often falls apart when analysts discover that important records contain null or missing values. Most machine learning methods require complete data, and software tools may discard incomplete records or bin them into an “other” category without warning.
This post presents a case study on the effects of missing data on a predictive model for customer churn. We have covered churn extensively in previous blog posts, webinars, and demos.
The Effects of Missing Data On a Predictive Model for Customer Churn
Customer churn is a great introduction to predictive modeling in business because relatively simple methods like logistic regression can be effective in this use case. In the logistic regression model, each customer has some unseen probability of churning within a defined time period. After that time has elapsed, the customer has a known outcome: either they churned or they did not. The true churn probabilities are never known, but the known outcomes from historical data are used to train the model, which learns how to predict the probability of churn from other features of the customer. The predicted churn probability is called the churn propensity, and can be used to make decisions about targeting a nurture campaign or other proactive intervention to prevent churn.
For the case study, we look at a fictional company with simulated data. This allows us to compare different patterns of missing data under otherwise identical circumstances. And, because the data are simulated, we can access the true churn probabilities to compare with the propensity scores output by the predictive model. Thus, through simulation we gain insights about the prediction errors in terms of both magnitude (how many percentage points off) and direction (over or under).
As the case study below shows, depending on the reason for data being missing, the effect on predictions can vary from negligible to masking a severe problem. Methods to repair missing data need to be tailored to the specific details of each use case, so we do not get into them in this post. Our goal today is to show examples of mechanisms that cause missing data and to (subsequently) highlight the consequences of ignoring the problem.
A Case Study
Let’s introduce Acme Corp, a fictional company providing solutions for the manufacturing, education, and technology verticals. Acme is concerned with customer churn, and is adopting an intervention that has a 70% chance of preventing any targeted customer from churning. However, Acme needs to know which customers are likely to churn so they can target the intervention.
Acme has implemented a logistic regression model to predict the propensity of each customer to churn in the next 30 days. That propensity depends on the customer’s monthly spend, which line of business they are in, and what type of lead their account came from.
- Spend: Monthly spend is the total amount spent on Acme and competitor products, so this information must be obtained by surveying the customers.
- Customers with lower spend are more likely to churn.
- Line of Business: Line of business corresponds to the customer’s vertical (manufacturing, education, technology).
- Technology is a competitive vertical, so these customers are more likely to churn than manufacturing or education customers.
- Source: Lead source (referral, phone, web) describes how the customer came into contact with Acme Corp. Referrals from other customers generate reliable accounts with frequent communication between customer and Acme reps. Phone leads also tend to have good rapport with the company and make repeat purchases. Web leads enter the pipeline by responding to online marketing campaigns or placing online orders, and often have no contact with Acme beyond submitting orders.
- Phone leads are moderately more likely to churn compared to referrals.
- Web leads are much more likely to churn than referrals or phone leads.
- The relationship between lower spend and higher churn propensity is even stronger for web leads than other lead types (an interaction).
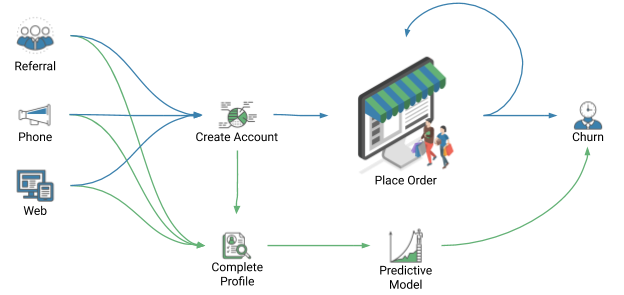
Figure 1: Illustration showing the parallel paths from customer to order to churn (blue), and from customer data to churn model to predicted churn propensity (green).
The diagram (Figure 1) illustrates the relationship between Acme’s sales and data pipelines. Customers arrive from one of the three sources, create an account, place an order, and then either place additional orders or churn. When the account is created, some profile information is recorded, but other data must be obtained from the customer. The profile data feed into the logistic regression model, which predicts the probability of churn. The predictive model relies on accurate and complete training data to provide useful predictions, and accounts with incomplete profiles must be dropped from the training dataset.
Acme currently has 50,000 customers. Unbeknownst to them (but known to us, since we concocted this example) 27,791 of those customers will churn in the next 30 days without intervention. If all 27,791 of these could be targeted for the intervention, only 8,374 would churn and the other 19,417 would continue as customers. Acme will use predictions from the logistic regression model to identify customers likely to churn and target the intervention. The company has identified 10,000 recent customers with known 30-day churn outcomes and will use these records for training the model. However, some of the 10,000 records are unusable because of missing data.
How Data Go Missing
Ideally, organizations like Acme Corp would be fully informed by all the data. Unfortunately, the reality of business is that all the data are not always available. It is important to ask why information is missing, both to be aware of possible biases and to identify areas where procedures can be improved.
Missing Completely Randomly
The “least bad” situation, perhaps surprisingly, is when records contain null values at random with no predictable pattern. This can be by design, such as when some individuals are chosen at random to take a survey and all others are excluded, or when a large training dataset is randomly subsampled to reduce computation time. It could also happen when paper forms are lost (independently, one at a time) before being transcribed into a database, or when a distracted individual skips a field during data entry. In reality, however, there is almost always a pattern unless data are missing by design.
When there is absolutely no predictable pattern of missingness, what remains is a representative sample. The reduced data volume can result in less certainty about decisions, but predictions are unlikely to be misleading.
Missing Because of Predictors
A worse scenario is when data are unavailable because of variables that would be useful for prediction or decision making. For example, if a month’s worth of records are lost in a computer crash, then visibility into trends over time is impaired because date is a predictor variable that is associated with missingness.
Another example would be if customers in a certain category or line of business receive less communication from the business and therefore provide less information. Those customers’ data cannot be leveraged to understand differences in an outcome across categories.
When potentially predictive variables are also predictive of missingness, the best possible result is increased uncertainty about the outcomes for segments afflicted by missing data. At worst this can result in model bias, especially when missingness masks a true association. Fortunately, this is often a situation where data can be recovered or imputed (but we will leave that topic for future posts).
Missing Because of the Outcome
The most harmful pattern of missingness is when records contain nulls because of the outcome being predicted. Consider the classic example where a seller wants to optimize the products in terms of ratings in customer reviews. Customers with strong opinions, whether positive or negative, are more likely to provide responses than customers with neutral opinions. This drowns out middle-of-the road sentiment which can provide the most actionable information in terms of turning an acceptable experience into a great one.
In terms of customer acquisition, retention, and churn, this can look like customers being more or less willing to communicate because they have already decided their actions. The consequences of data being missing because of the outcome include incorrect conclusions about how many outcomes fall in a certain category and/or inability to learn why an outcome happens a certain way.
Read our next post to dive into the consequences of missing data as related to our case study.