A Treatise on Data Science and Customer Churn
Contributing Authors: Peter Ottsen and Anthony Nardiello
Proactively Addressing Churn with Data Science
In part 1 of our series, you were introduced to Magenta Inc., a fictional company facing issues with customer churn. Elaine Gadget, Magenta’s Senior Sales Representative, has already worked with her team to identify an important problem—the sales team has no visibility to see service cases or fulfillment data.
Part 2 of our blog series explored how Elaine could work with Magenta’s Senior Data Architect, Jake Custer, to leverage Snowflake to connect order data with Salesforce, the system that Elaine uses every day.
While connecting data pipelines is important, Magenta still has work to do. By investigating why customers churn, salespeople like Elaine can be better armed with knowledge about potential pain points and utilize tools to identify customers with high churn risk. Then, with proactive intervention, they can solve potential problems and keep their customers around.
Thankfully, Magenta has teamed with Atrium to help answer those questions. Atrium has a defined methodology around using statistical models to identify trends in data, build predictions, and surface them for end users in Salesforce.
Defining Churn
A critical first step in building a churn model is to define exactly what it means for a customer to churn. Defining customer churn is not always easy. In some cases, the picture is black and white: a customer simply stops transacting, or transfers their business to a competitor. However, customer churn doesn’t have to be so narrowly defined. As Elaine looks at her customers in Salesforce, she realizes that some of them have not completely stopped purchasing, but are buying 75% fewer widgets than they had been previously purchasing. In some cases, they’ve stopped purchasing entirely; both types of churners are causing problems for Magenta’s bottom line. Figure 1 shows a sample of customer profiles for regular customers, a customer who completely stopped buying, and one who drastically reduced their spend.
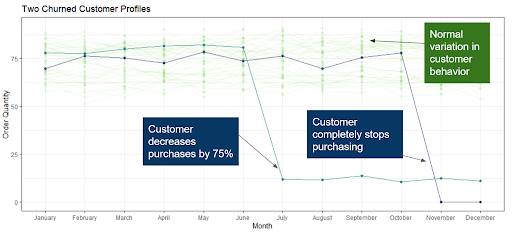
Figure 1: Customer profiles for normal customers as well as churned customers.
Working with Atrium’s crack team of data scientists, Elaine determines that the best way to define churn is any customer who decreases their month-over-month purchase rate by at least 75%. This definition includes both the purple and teal customers shown in Figure 1.
Exploratory Data Analysis
Prior to building any models, it is important to understand the breadth and depth of the historical data available. Atrium starts any modelling effort off with a thorough exploratory data analysis (EDA). EDA involves an assessment, summarization, and visualizations of the quality, structure, and correlation/signal present in the data. Typically, we assess product data, customer data, and operational data to uncover initial insights related to customer churn.
At Magenta, not all the relevant information for understanding customer behavior is in Salesforce—but thanks in part to Jake Custer’s brand new integration between Snowflake and Salesforce, many of the most important pieces of information are now available to be explored and easily accessible in a single location.
Often, EDA is performed outside of Salesforce, using tools like R or Python. Fortuitously, Snowflake provides connectors to R and Python and can enable efficiencies in exploration of data. Using these connectors and a little SQL, data can easily be imported and analyzed. This also highlights the benefit of having centralized data storage in Snowflake—data can be imported with a few lines of code instead of having to track down different data sources or design complex integrations prior to analysis.
Product Segmentation
In early conversations with Atrium’s data scientists, Elaine mentions that different segments of Magenta’s products are subject to unique customer dynamics. Atrium’s team decides to investigate product attributes across Magenta’s four major product segments: Aerospace, Light Manufacturing, Oil & Gas, and Life Sciences.
A pattern quickly emerges: customer order cadences are quite different across the different product segments, and churn rates vary substantially as well, as shown in Figure 2. Additionally, we see a counter-intuitive relationship between purchase cycles and churn rates; in Oil and Gas, for instance, churn rates are near 40% with purchase cycles of fewer than 10 days. These differences could provide useful information in generating accurate predictions.
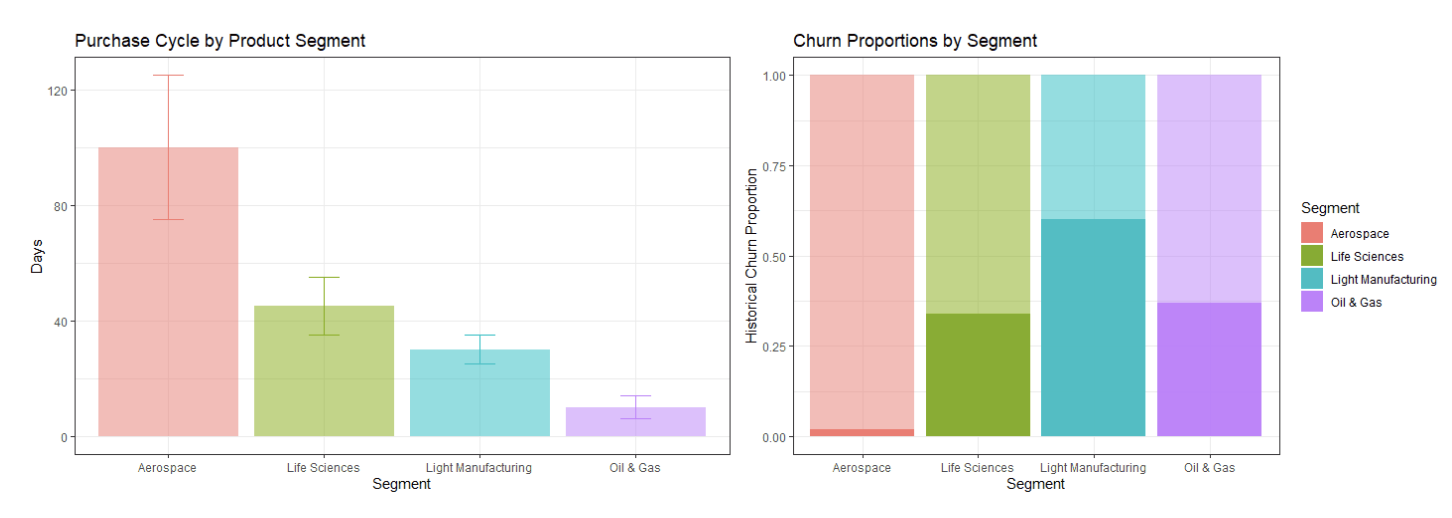
Figure 2: Variability in purchase cycles and churn proportions by product segment.
Operational Efficiency: Factory Locations
After meetings with Magenta’s subject matter experts, Atrium’s consultants hear feedback that Magenta also experiences variability based on geographic location. Because of the way that Magenta has grown as a company, its four different factories operate relatively autonomously. By exploring this hypothesis with a little more in-depth analysis, Atrium’s consultants quickly identify that the San Diego widget factory has higher median turnaround times than any other factory: almost 20 days more than their Billings location, as shown in Figure 3. All of this can lead to higher churn rates, particularly for customers who interact with the San Diego location. By leveraging client expertise to drive a pointed analysis of the data, they have found an important predictor to consider in the model.
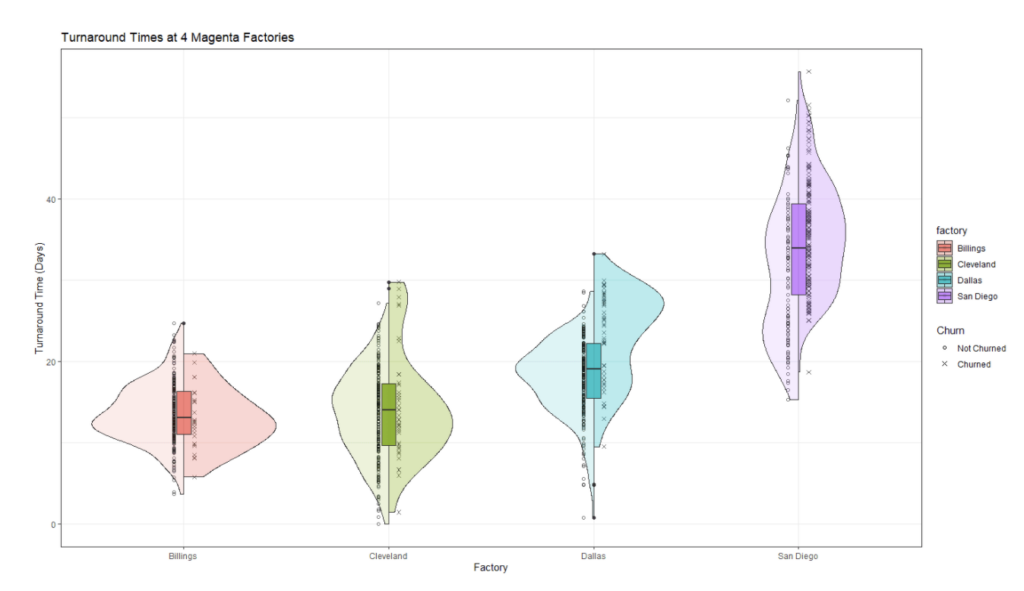
Figure 3: Turnaround times at each of the four Magenta factories.
Model Build
After a thorough EDA, it is now time to build the predictive model. Recall that the response variable of interest is identified as a binary feature, meaning it takes on only two values: either a customer is retained (1), or the customer leaves (0). Logistic regression is an effective tool for both predicting an end state for each customer (either retained or not), and also predicting an estimated probability of retention for each customer on a 0—100% point scale.
Einstein Discovery in Action
A common problem when designing and implementing AI-driven solutions at the enterprise level is that machine learning models are hard to productionize and can take a long time to provide meaningful insights to end users. However, Magenta is using Tableau CRM along with Einstein Discovery, which provides them a set of tools to quickly deploy predictive models and surface results in Salesforce, the same system that Elaine and her team use every day.
In some cases, it is necessary to utilize custom tools such as those available in AWS, Azure, or similar cloud-based solutions. Atrium can help with those tools as well!
Feature Engineering
Now, we have both a candidate set of features to be included in the final model, and a platform to productionize it. However, the model needs to be calibrated in the best way possible prior to deployment. The first step in building the final model is to engineer any additional features that are necessary to derive predictive signals from the data. This process, called feature engineering, can be a critical step to turn features that may not be useful in their current state into features that are.
For example, a field like Sale Date might not be particularly useful in generating predictions for future sales. However, the month of sale, or the day of week, is potentially useful information that might capture seasonal differences in customer behavior. Additionally, identifying time deltas—the difference between key dates in a customer lifetime—can provide critical insight into how a customer dynamically changes over time.
There are also other avenues of analysis that Atrium can layer in such as CLV or Clustering methods but we can’t give away all our secrets in one blog!
Model Selection
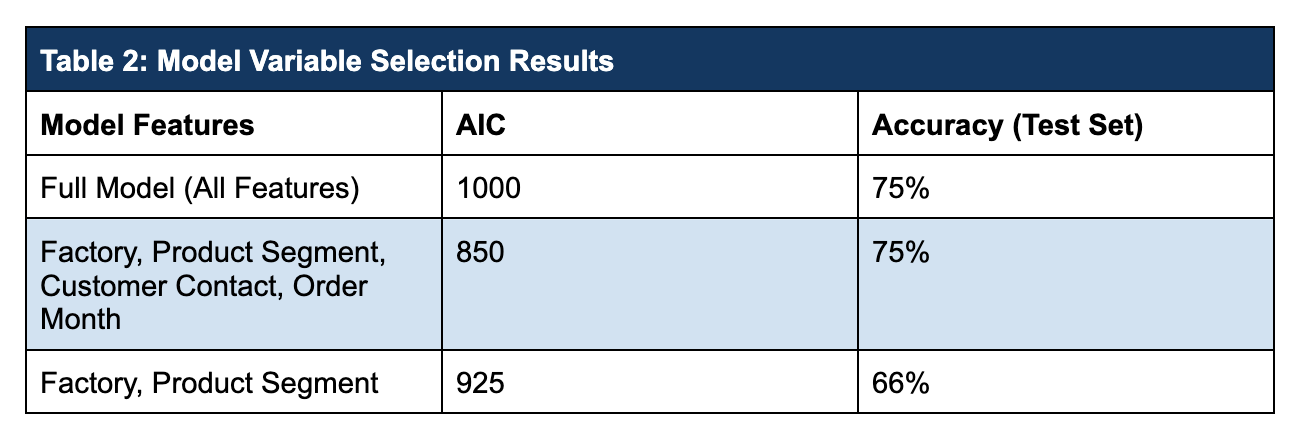
The table below shows the list of candidate features to be considered for this first version of the predictive model. All the data below is available either directly from Salesforce, or via Snowflake, and can be connected directly to Einstein Discovery to be used in both model training and in live scoring.
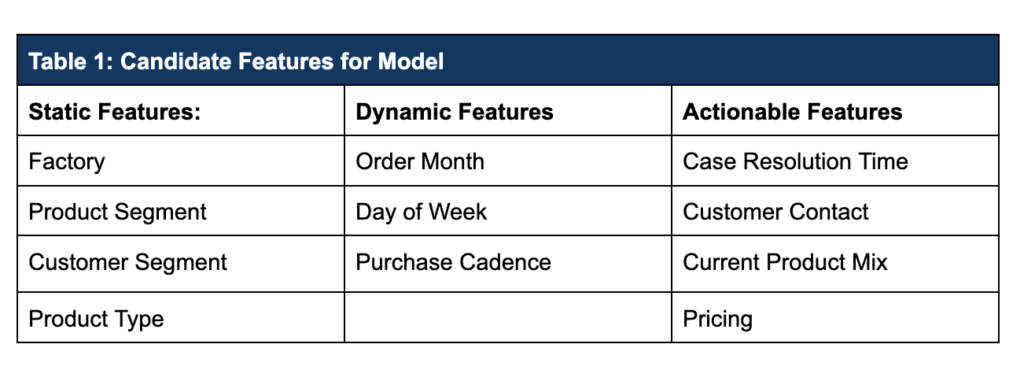
The final set of features is typically determined via a process called feature selection, which can be performed in several ways. Often, a good way to get to a final version is to start with a full set of features and pare back the model one variable at a time. Statistics which measure model fit (usually Akaike’s Information Criterion, or AIC) can be compared, and the model with the optimal value is chosen. Accuracy on a hold-out test set can also be used to help determine which model is best.
Atrium’s data science team fit multiple models and compared them. The full model with all features considered and a reduced model with only 4 features both predict with 75% accuracy. Based on AIC (smaller is better), the 4-variable model is selected as optimal.
Now that the right features have been identified, Atrium builds the final model in Einstein Discovery. Afterwards, it is necessary to deploy the model so it becomes visible for Magenta. This can be done easily through Einstein Discovery’s point-and-click interface and No-Code writeback. (We recommend No-Code writeback in many situations, but it is one of several options for deploying models). Building and Deploying the Model to Action Results
Model results can be written back to the object of interest in Salesforce (lead, opportunity, account, etc.) and displayed directly on the object or in a list view, or the results can be written to a lightning card. Additionally, scores can be generated directly in Tableau CRM and displayed in dashboards using the Einstein Predictions Transformation in recipes. At Magenta, it’s helpful for Elaine’s team to see scores for individual accounts, and a listview helps her to quickly sort customers based on their predicted churn risk, as seen in Figure 4.
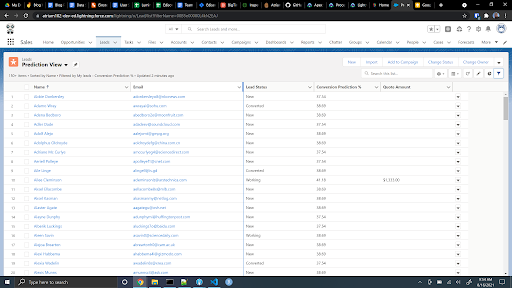
Figure 4: Turnaround times at each of the four Magenta factories.
With many options to deploy models, organizations like Magenta have to think strategically about how and when to best surface the predictions from an Einstein model. We recommend a mix of displaying scores or score-based categories to sales representatives, and let managers like Elaine see the entire picture, including churn score reports in Tableau CRM. It can also be advantageous to link the results of a Discovery model to automated tools like Einstein Next Best Action to build data-driven early warning systems to identify potential churners.
Data Drift and Model Maintenance
What happens to Magenta’s model as sales processes, customer behavior, or economic conditions change? Often, models are subject to a process of degradation known as “model drift” that can, over time, diminish the efficacy of the predictions they generate. To keep models performing as effectively as possible, they need to be periodically updated and retrained. Atrium can help with long-term model monitoring and re-training strategy as well.
Leverage Predictive Models to Combat Churn
Churn is a serious problem, and retaining customers can be a challenging process for businesses. However, taking a data-driven approach to efficiently and proactively identify customers who are at high risk of attrition can lead to companies like Magenta keeping more of their customers around for the long term.
At the beginning of this process, Elaine knew she had a problem with customer churn but she had no visibility to external systems that contained critical customer information. Using Snowflake to bring order data into Salesforce allowed her to see more of that information and view a more complete picture of her customers. It also enabled Magenta to leverage predictive models to identify potential churners and proactively address issues before customers leave. Now, Elaine and her team have access to key insights, helpful predictions, and meaningful reports all served up in Salesforce.